EUR/USD 5M Analysis
On Tuesday, EUR/USD once again traded with low volatility, though the movement was clearly downward—continuing the pattern seen on Monday. As a result, the beginning of the new week continues to favor the U.S. dollar. As for the reasons behind this move, are they still relevant? For three weeks in a row, we've been repeating the same point: there are no valid reasons for the dollar's growth. Still, on the daily timeframe, the price remains within a flat structure, and within this range (spanning over 400 pips), movements can be entirely random—which is precisely what we're witnessing.
There were no significant events or data releases on Tuesday from either the Eurozone or the United States. Not even Donald Trump made any notable comments. Thus, the market had nothing to react to, and yet once again the U.S. dollar strengthened "out of nowhere." At this point, the 1.1604–1.1615 area is offering some support to the euro, but that's not the crucial issue. What truly matters is how easily and effortlessly the price passes through Ichimoku indicator lines, which, in our view, makes the daily timeframe the most relevant for analysis at the moment.
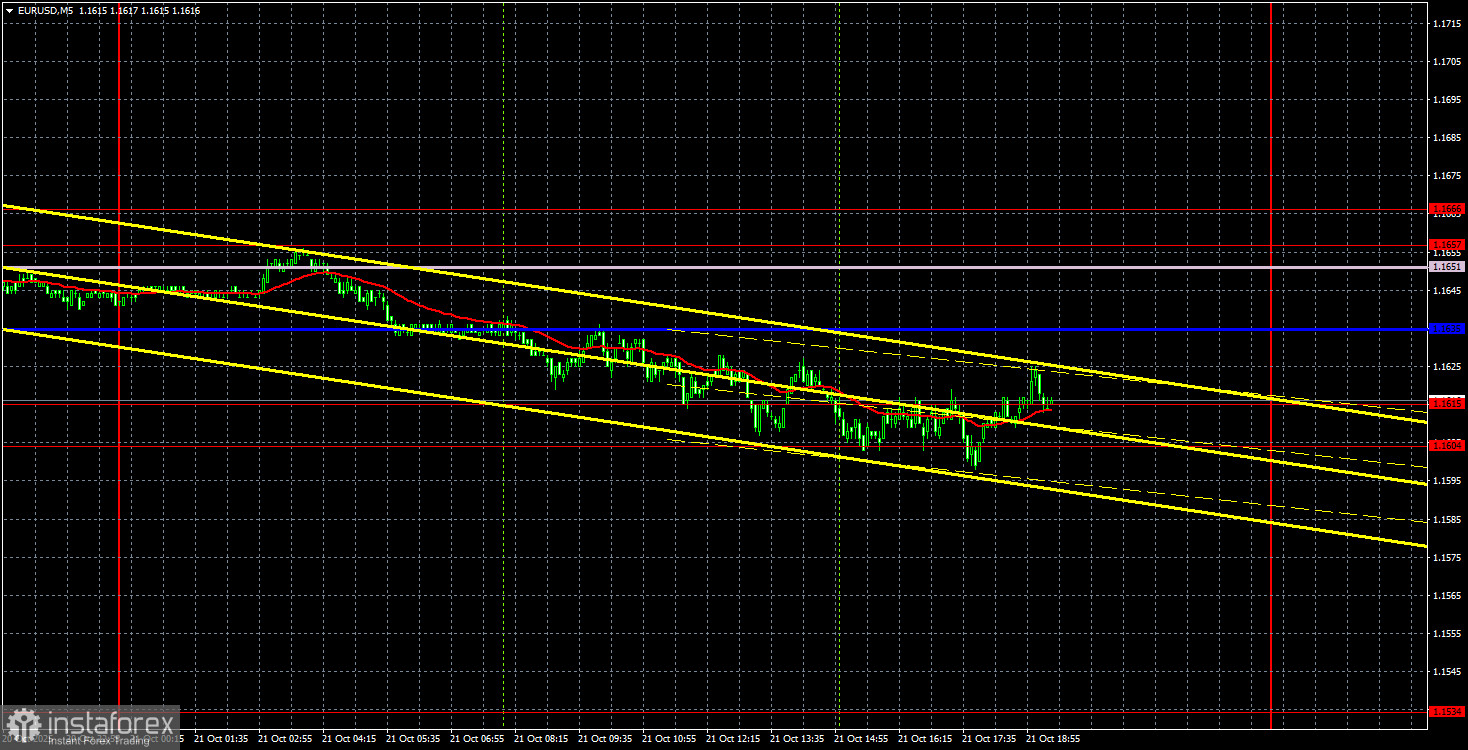
On the 5-minute chart, the intraday movements can be clearly observed. The pair descended from the 1.1657–1.1666 area, smoothly passed through the Senkou Span B and Kijun-sen lines, and paused near 1.1604–1.1615. There were no viable entry points, as the price encountered new levels and lines every 10 to 15 pips, leaving no space for unconflicted positions.
COT Report
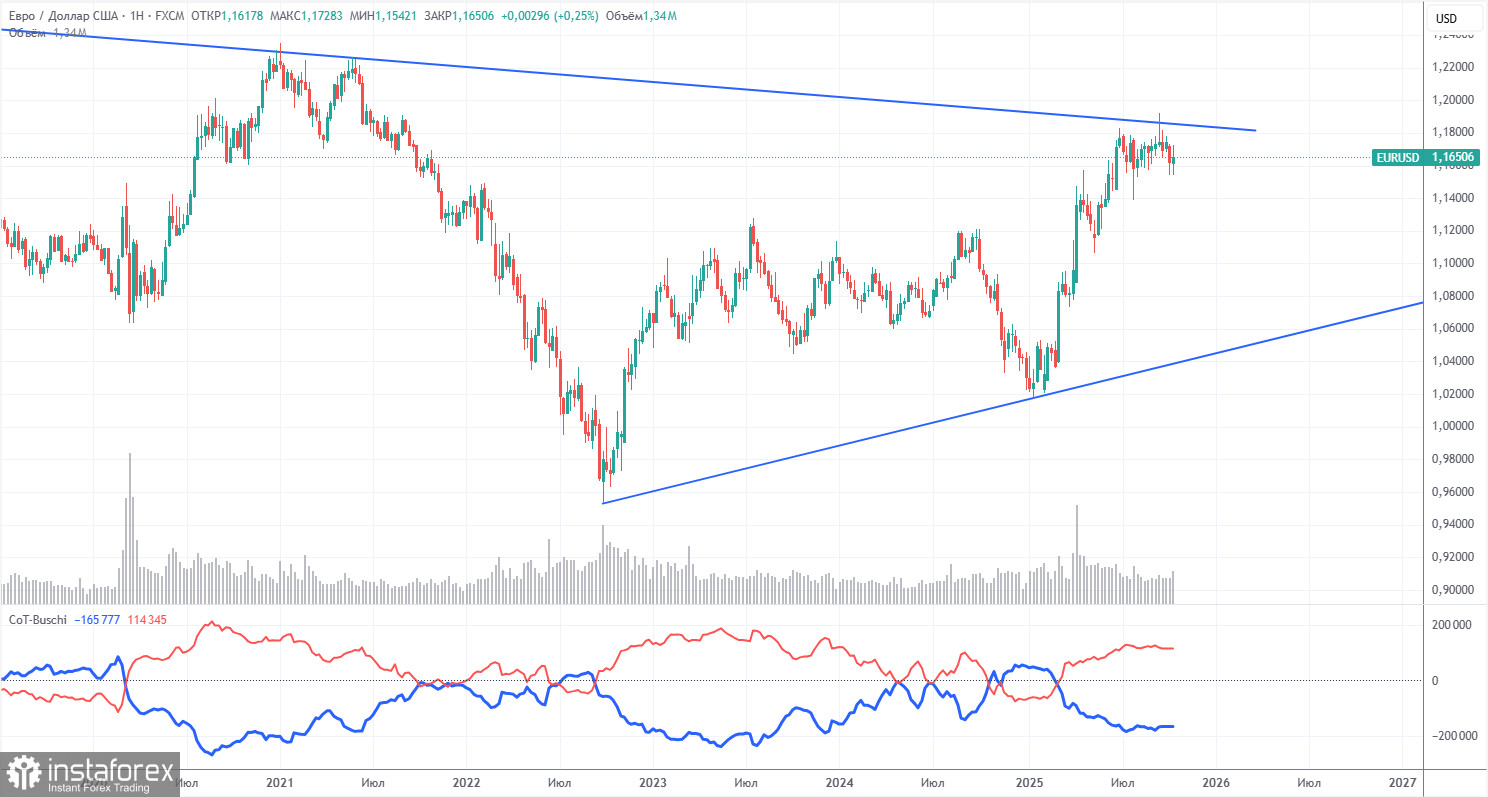
The latest Commitment of Traders (COT) report is dated September 23. No new data has been released since then due to the U.S. government shutdown. The chart above shows that non-commercial traders' net positions remained bullish for a long time. Bears briefly gained control in late 2024, but quickly lost it again. Since Trump returned to office for a second term, the dollar has been consistently losing value.
While we can't say with certainty that this decline will continue, recent global developments suggest that the likely scenario is further U.S. dollar weakness. Once Trump's trade wars eventually conclude, a dollar rebound is possible. However, recent trends suggest that trade tensions will persist in some form. The potential loss of Federal Reserve independence is another major source of pressure on the greenback.
The positioning of the red and blue lines on the indicator still suggests a persistent bullish sentiment. During the last reporting week, the number of long positions among non-commercial traders declined by 800 contracts, while shorts increased by 2,600, leading to a net reduction of 3,400 contracts. However, this data is now outdated and largely irrelevant.
EUR/USD 1H Analysis
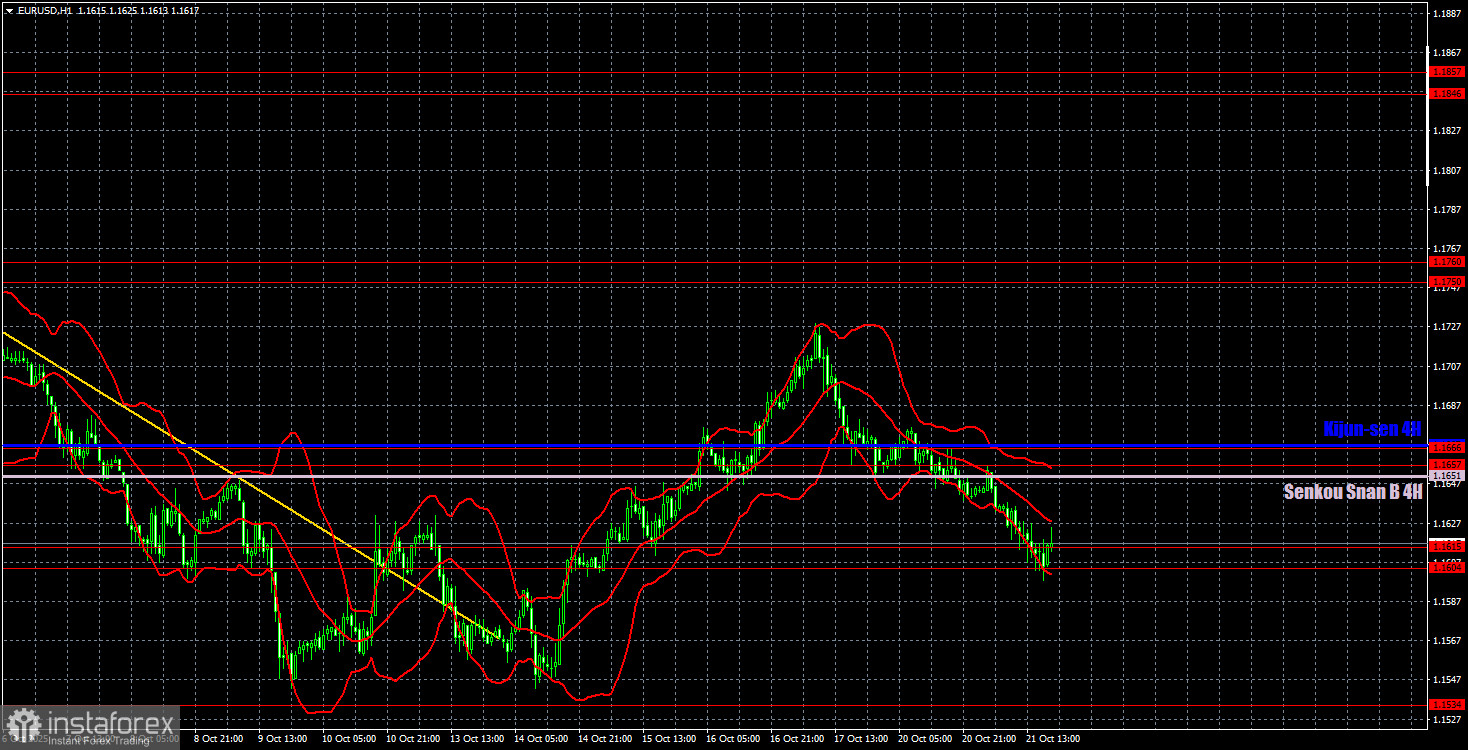
On the hourly timeframe, EUR/USD may have ended its bearish trend two weeks ago. Still, the euro has been falling confidently in recent days—a move that's increasingly difficult to explain without venturing into science fiction. We believe the underlying cause of these illogical movements is the flat range on the daily timeframe. If the 1.1604–1.1615 area is breached, the decline is likely to continue regardless of fundamental justification.
For October 22, the following levels are relevant for trading: 1.1234, 1.1274, 1.1362, 1.1426, 1.1534, 1.1604–1.1615, 1.1657–1.1666, 1.1750–1.1760, 1.1846–1.1857, 1.1922, 1.1971–1.1988, as well as the Senkou Span B line at 1.1651 and the Kijun-sen line at 1.1667. Note: the lines of the Ichimoku indicator may shift throughout the day, and this should be accounted for when identifying signals. Also, when the price moves 15 pips in the intended direction, set the Stop Loss to breakeven. This will protect against losses from false breakouts.
On Wednesday, European Central Bank President Christine Lagarde will speak once again in the Eurozone. However, she has spoken at least ten times over the last few weeks, and none of those appearances provided the market with meaningful information. In the U.S., the economic calendar is empty once again.
Trading Recommendations:
On Wednesday, traders may look to trade from the 1.1604–1.1615 area. To open long positions targeting 1.1651, wait for a clear rebound from this area. Short positions may be considered if the price consolidates below 1.1604–1.1615, with a bearish target at 1.1534.
Explanation of Chart Elements:
- Support and resistance levels – thick red lines where price movement may pause or reverse; not direct trade signals
- Kijun-sen and Senkou Span B – Ichimoku indicator lines transferred from the 4H to the 1H timeframe; they are considered strong levels
- Extremes – thin red lines where price has previously reversed; they may act as trade triggers
- Yellow lines – trendlines, channels, or other technical formations
- COT Indicator 1 – net position size of each trader category