EUR/USD 5M Analysis
The EUR/USD currency pair continued trading with gains on Thursday. Not even the latest monetary policy easing by the ECB could save the dollar. Yesterday, the European regulator decided for the eighth time to cut all three key rates, which is, of course, a "dovish" decision and a "bearish" factor for the euro. However, the euro experienced no discomfort from this at all. Immediately after the announcement of the meeting results, the euro continued its northward movement as if nothing had happened and only pulled back slightly toward the evening. Once again, we witnessed the euro rising where the dollar should have strengthened.
In principle, all other information from the ECB is of little importance. The ECB lowered its forecasts for inflation for 2025–2027 and also lowered its GDP forecasts, which indirectly hints at maintaining the course of monetary policy easing. Of course, the key rate is now already 2.15%, so it is unlikely that the pace of rate cuts will continue at the same speed. Nevertheless, the ECB could ease policy once or twice more, as some members of the monetary committee previously stated.
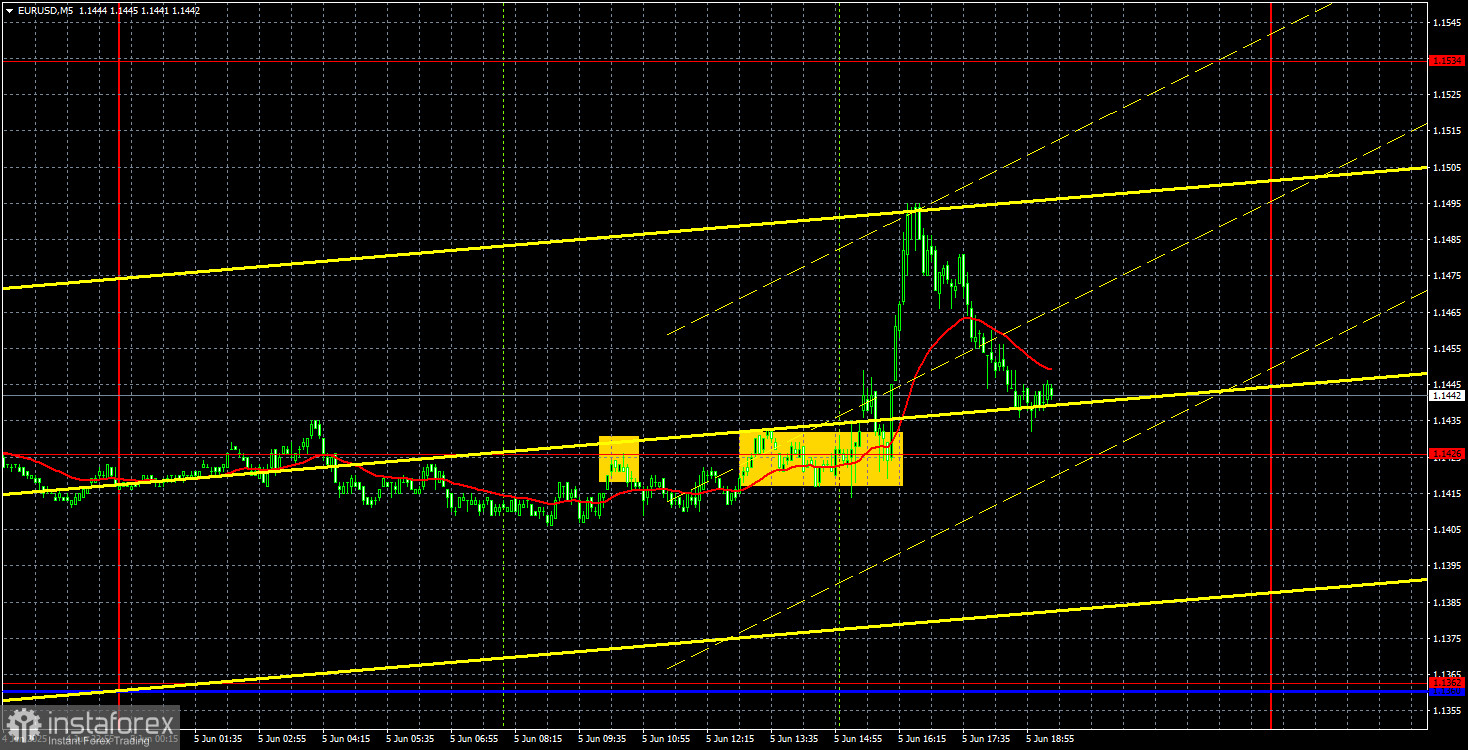
On the 5-minute timeframe, two trading signals were formed yesterday, but it would have been better to skip them. First, the pair rebounded from the 1.1426 level, which allowed for opening short positions. However, as the ECB meeting approached, the chances of profiting from this trade dwindled since price movements didn't even allow for setting a breakeven Stop Loss. It was better to exit the market before the announcement. The next buy signal was formed right during the announcement, so it was not advisable to act on it either, especially since the meeting results clearly did not suggest a rise in the euro.
COT Report
The latest COT report is dated May 27. The illustration above shows that the net position of non-commercial traders had been "bullish" for a long time; bears barely gained the upper hand at the end of 2024 but quickly lost it. Since Trump assumed the presidency, the dollar has been plunging into an abyss. We cannot say with 100% certainty that the decline of the U.S. currency will continue, but current global developments hint strongly in that direction.
We still see no fundamental factors for the euro's strengthening but there remains one very significant factor for the dollar's decline. The global downtrend is still intact, but what is the value of a trend now? As soon as Trump ends his trade wars, the dollar could start rising — but will Trump ever end his wars? And when?
At the moment, the red and blue lines have crossed again, so the market trend is once again "bullish." During the last reporting week, the number of longs in the "Non-commercial" group decreased by 1.7 thousand, and the number of shorts by 6.7 thousand. Consequently, the net position declined by 5.0 thousand over the week. However, COT reports are released with a one-week lag. Currently, the market is actively buying the EUR/USD pair again.
EUR/USD 1H Analysis
On the hourly timeframe, the EUR/USD pair maintains a local upward trend, which is part of a 4-month trend. The outlook for the U.S. dollar still depends on developments related to the Global Trade War. For now, we can only say one thing: peace agreements are absent, and Trump continues to make strange decisions and statements that regularly shock market participants. The market continues to expect the worst, and Trump keeps confirming that expectation.
For June 6, we highlight the following levels for trading — 1.0949, 1.1006, 1.1092, 1.1147, 1.1185, 1.1234, 1.1274, 1.1362, 1.1426, 1.1534, 1.1607 — as well as the Senkou Span B (1.1317) and Kijun-sen (1.1405) lines. The Ichimoku indicator lines may shift throughout the day, which should be taken into account when determining trading signals. Don't forget to set a Stop Loss at breakeven if the price moves 15 points in the right direction. This will protect against possible losses if the signal turns out to be false.
On Friday, probably the most important reports of the week are scheduled. In the U.S., Nonfarm Payrolls and the unemployment rate will be published. In the EU, the third estimate of Q1 GDP will be released. Obviously, all market attention will be focused on U.S. statistics. If it turns out to be weak, it's clear what fate awaits the dollar.
Explanation of the Illustrations:
- Support and resistance price levels — thick red lines where movement might end. They are not sources of trading signals.
- Kijun-sen and Senkou Span B lines — Ichimoku indicator lines transferred to the hourly timeframe from the 4-hour one. These are strong lines.
- Extreme levels — thin red lines from which price has previously bounced. These are sources of trading signals.
- Yellow lines — trendlines, trend channels, and any other technical patterns.
- Indicator 1 on the COT charts — the size of the net position of each category of traders.