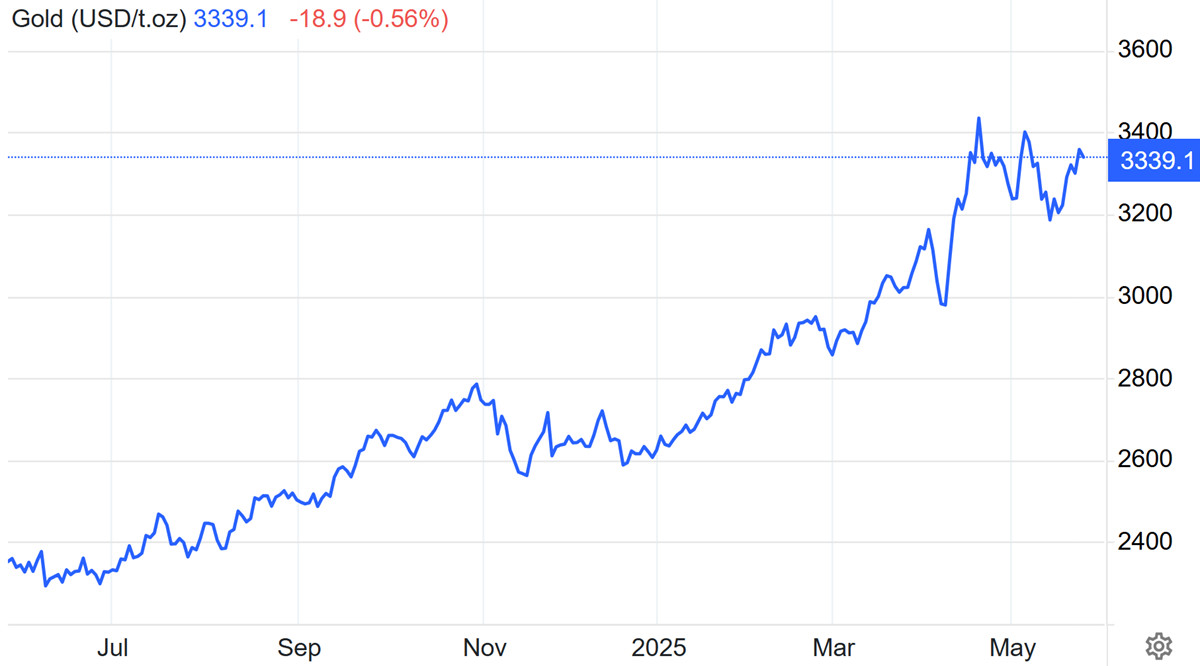
The gold market has recently been highly volatile, with dramatic movements in both directions. After breaking above $3,000 per ounce, the metal entered a phase of heightened volatility—testing resistance at $3,350, pulling back to $3,300, and climbing again.
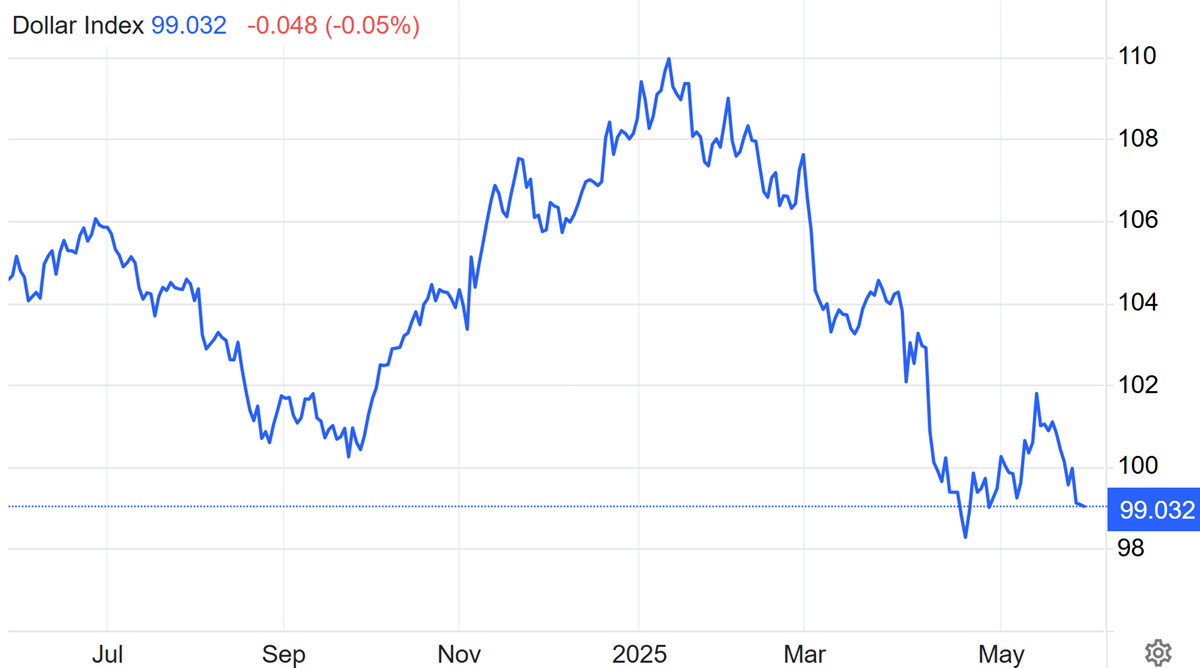
The technical range has remained stable, with dynamic resistance at $3,350 acting like a magnet for price. At the same time, the U.S. dollar index (DXY) is steadily sliding below 99.0 points, and gold—historically inversely correlated with the dollar—is rising in tandem with this weakness.
Traders have noticed that every dip toward $3,300 is quickly bought up. This isn't just market noise—it's positioning for the next upward impulse.
Goldman Sachs Opens the Door to $4,200
Goldman Sachs has raised its base forecast for gold (XAU/USD) and outlined a potential roadmap to $4,200 per ounce. Although this is still considered a "tail-risk" scenario, it is now being taken seriously.
The bank's base target is $3,300, with an expanded trading range of $3,250–$3,520. Yet the entire market is fixated on that extreme number.
Why? Because gold has already surpassed the core target, and the fundamentals are on its side. The $4,200 scenario is not merely a fantasy but a likely outcome of various macroeconomic challenges.
Three Pillars of the Rally: Central Banks, the Fed, and ETFs
First, central banks. The East continues to buy gold with persistence worthy of a macroeconomics textbook. China, Turkey, and India are leading the pack, with total purchases expected to reach 1,000 tons by year-end. The trend has remained unbroken since 2022. These purchases are not speculative—they represent a structural shift in the global reserve system.
Second, the Federal Reserve. The market is already pricing in two rate cuts in 2025. But if the U.S. economy stumbles and recession worsens, monetary easing could become aggressive. In a world of lower rates, gold becomes a star. Under such conditions, capital rotation from bonds into gold is just a matter of time.
Third, ETFs. While retail investors have been cautious, that's changing. Gold fund inflows reached $296 billion in Q1—a record since 2021. If that pace holds, annual flows could reach $500 billion. That would not just be support—it would be a launchpad.
But Not All Is Smooth: Risks Remain
Goldman Sachs also points to clouds on the horizon. A peace deal between Russia and Ukraine could trigger short-term profit-taking and a price pullback—though the bank sees this as a temporary effect, unlikely to alter the fundamental demand-supply trend.
A stock market crash could also temporarily hurt gold—as part of a "sell everything" panic. But history shows that once the first wave of fear subsides, gold reasserts itself as a safe haven. That's when real growth begins amid a flight to safety.
Current Price Action and Technical Outlook: Gold in a Wait-and-See Phase Near the Trendline
Gold has entered a consolidation phase after a strong rally, with all attention now focused on U.S. economic data and Fed signals. Investors have adopted a wait-and-see approach ahead of FOMC minutes, GDP figures, durable goods orders, and the PCE index—all of which could shift short-term demand-supply dynamics.
From a technical perspective, gold is holding within a descending channel that has been forming since mid-April. The price has again reached the upper boundary near $3,358, which has previously acted as a reversal point.
How the price behaves here is key to determining the next move: a strong breakout with confirming volume and a trend reversal or another pullback toward support.
If sellers return, the $3,307–$3,300 zone will serve as the first line of defense, followed by the $3,258 area and key support near $3,240–$3,245.
These are the zones where demand previously increased, and bouncebacks occurred. A break below them could signal a move toward the channel's lower boundary—around $3,100, where an important long-term support level is located.
If, on the other hand, gold manages to consolidate above resistance at $3,386 (R1) amid dollar weakness and rate-cut expectations, the next step will be a test of $3,415 (R2), followed by a path toward $3,440 and potentially historic highs near $3,500.
Fundamentally, the yellow metal continues to receive support: the dollar is weakening, interest rates may fall, and U.S. fiscal policy is raising investor concerns. Meanwhile, the recent agreement between Trump and von der Leyen to temporarily postpone tariffs only slightly lowered the geopolitical temperature and triggered a brief shift toward risk.
But in essence, this is not a cancellation—it's a pause. Geopolitical and financial risks remain, and they continue to favor gold.
What Should Traders Do?
Gold at current levels is not "expensive" but "unstably stable." Every dip to $3,300 is a chance to accumulate. Support is well-defined. Resistance at $3,350 is only a matter of time before it breaks. If external conditions align, the next target is $3,520.
And if the market gets all three drivers at once—a falling dollar, rising geopolitical tensions, and a Fed rate-cut signal—then even $4,000 may not be the ceiling.