The EUR/USD currency pair continued to move upward on Thursday. There were several macroeconomic events scheduled for the day, and they did provoke a small market reaction, as we had anticipated. However, who would care about a 20–30 pip movement at this stage? Before the European Central Bank meeting results were announced, and despite the publication of six business activity indices, the pair's volatility was only 38 pips. From our point of view, it's much simpler to say the market showed no reaction at all to the European business activity indices, rather than trying to extract a 10-pip movement from the chart.
As for the ECB meeting, there were no surprises, as expected. All three key interest rates remained at their previous levels, and the ECB took the long-awaited pause, just as most traders had predicted. There are currently no uncertainties regarding ECB policy. The ECB has succeeded in bringing inflation down to nearly 2%, so maintaining rates at a restrictive level is no longer necessary. Eight rate cuts were enough to stop inflation from slowing further, as the ECB also does not want to see it fall below 2%.
What happens next after the pause?
Much will depend on the trade deal between the U.S. and the EU. According to the latest information, such an agreement is still possible. However, as we have said many times, the tariffs imposed by the U.S. will remain in place. The size of these tariffs will affect inflation—certainly in the U.S., and possibly not at all in the EU if no retaliatory measures are introduced. If the EU does not impose counter-tariffs, U.S. goods will not become more expensive in the European market. Therefore, the European Consumer Price Index (CPI) will have no reason to increase. As a result, future inflation may fluctuate slightly around the 2% mark.
This leads to two possible scenarios:
- If inflation continues to decline slowly, the ECB may opt for one or two more monetary policy easings to halt the trend.
- If inflation remains near 2% or rises slightly, there will be no need for further rate cuts.
Now, the most important point: everything written above currently has no real influence on the European currency. In the past, the market carefully monitored any changes in central bank monetary policy. But in 2025, that is no longer the case—because only the U.S. dollar is falling. It is weakening for well-known and still relevant reasons, and therefore, we believe the dollar will continue to decline.
The trade deal with Japan did not help the dollar in any way. Nor did the news that a U.S.-EU deal may be possible. Why? Because in both cases, the topic is a reduction in global trade tensions. We've already addressed this question: the issue lies in Donald Trump's overall policy, as well as the fact that all trade deals still include U.S. import tariffs. In other words, these trade agreements do not imply a true trade truce.
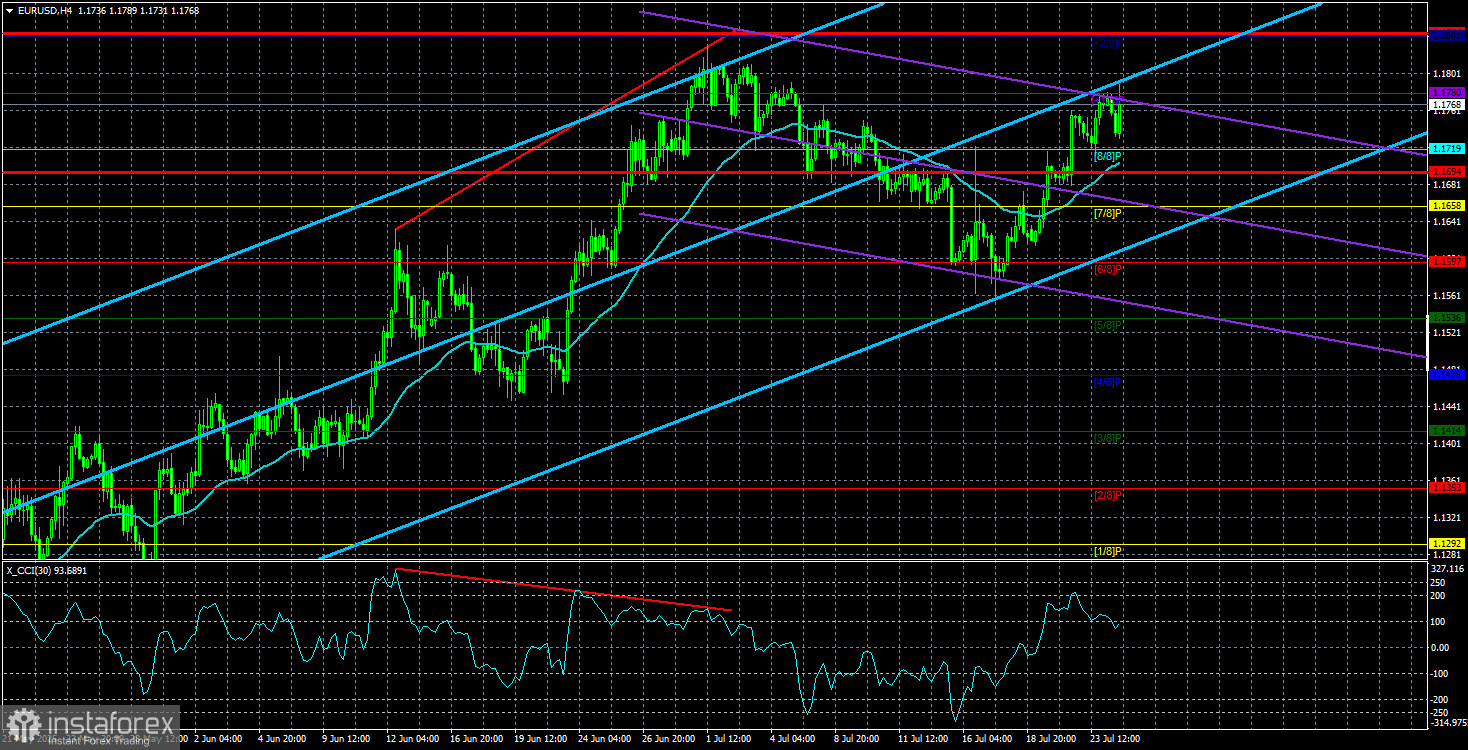
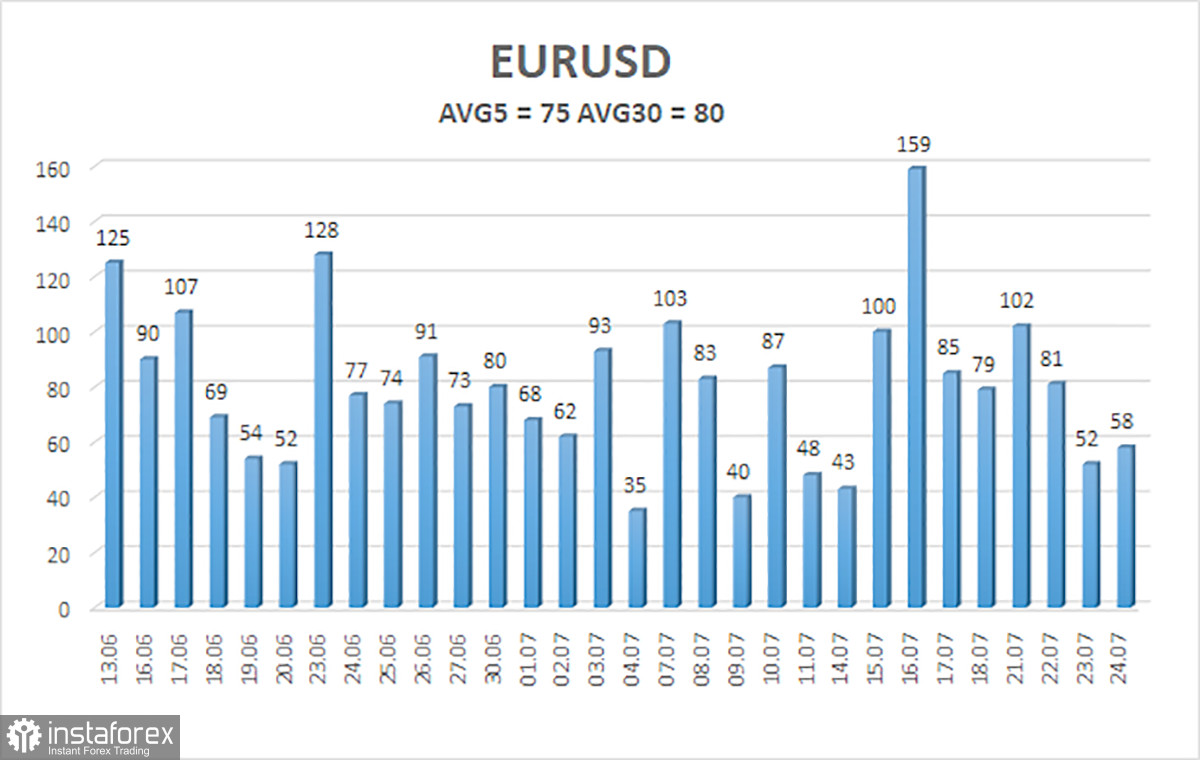
The average volatility of the EUR/USD currency pair over the last five trading days, as of July 25, is 75 pips, which is considered "moderate." We expect the pair to move between the levels of 1.1694 and 1.1844 on Friday. The long-term linear regression channel is pointing upward, indicating a still-bullish trend. The CCI indicator entered the oversold zone, which signaled the renewal of the upward trend.
Nearest Support Levels:
S1 – 1.1719
S2 – 1.1658
S3 – 1.1597
Nearest Resistance Levels:
R1 – 1.1780
R2 – 1.1841
Trading Recommendations:
The EUR/USD pair has resumed its upward trend. At the very least, the price has consolidated above the moving average and continues to head north. Trump's policies—both foreign and domestic—continue to exert intense pressure on the U.S. dollar. The dollar has shown a slight rise in recent weeks, but in our view, there is still no case for medium-term buying. If the price is below the moving average, small short positions may be considered with targets at 1.1658 and 1.1597 based purely on technical grounds. As long as the price remains above the moving average line, long positions remain relevant with targets at 1.1841 and 1.1844 in line with the ongoing trend.
Explanation of Illustrations:
Linear Regression Channels help determine the current trend. If both channels are aligned, it indicates a strong trend.
Moving Average Line (settings: 20,0, smoothed) defines the short-term trend and guides the trading direction.
Murray Levels act as target levels for movements and corrections.
Volatility Levels (red lines) represent the likely price range for the pair over the next 24 hours based on current volatility readings.
CCI Indicator: If it enters the oversold region (below -250) or overbought region (above +250), it signals an impending trend reversal in the opposite direction.