
MobileTrader
MobileTrader: trading platform near at hand!
Download and start right now!

 28.05.2025 11:47 AM
To be at the center of global attention and to "shape the planet's destiny" — that's what Donald Trump enjoys most. For him, it's essential to constantly generate headlines and watch markets tremble while media outlets explode with breaking news. As for the US president's plan to make America great again, the central goal remains reducing the trade deficit. Trump believes this deficit reflects decades of other countries "ripping off" the United States for hundreds of billions of dollars each year.
Donald Trump 2.0 has returned to restore global justice. One of his chosen tools is the implementation of sweeping tariffs. That, however, is nothing new — he did the exact same thing during his first term in office. Now, the expanded US tariffs affect 60 countries, but the most striking question is: why has country #1 on the list been hit so hard?
Amid the tariff chaos orchestrated by Donald Trump, investors are gradually pulling out of the US economy and its stock markets, the world's largest. Some of the capital is flowing into Europe. Over the past year (as of May 16), European equity ETFs received €34 billion in inflows. In contrast, US equity funds attracted only €8.2 billion during the same period, according to Morningstar.
Meanwhile, China has been offloading so many US Treasuries that it has now dropped to third place among major foreign holders. The United Kingdom has taken second, with holdings worth $352 billion.
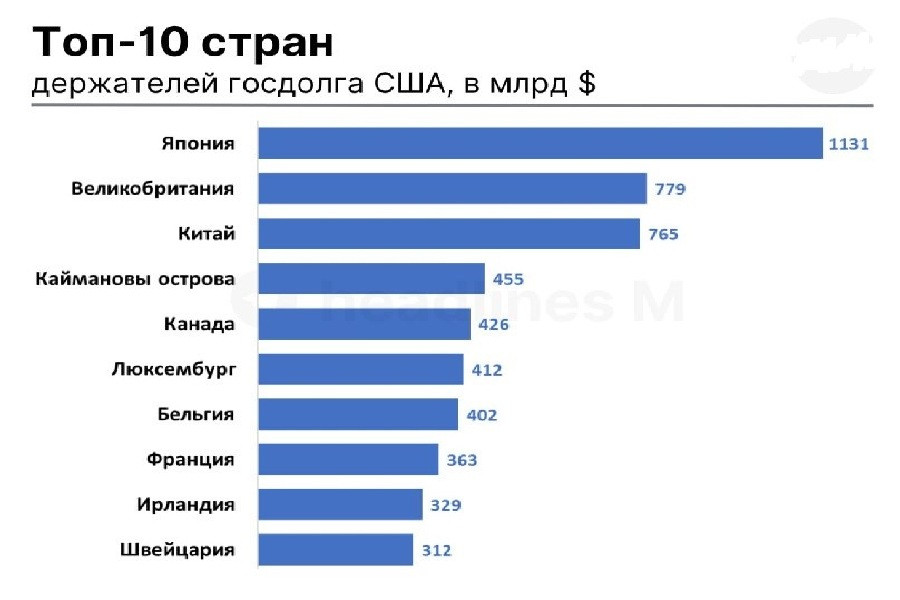
Japan remains the largest holder of US government debt, with holdings totaling $1.13 trillion, making it the primary risk factor for US Treasuries. The era during which Japan reliably provided cheap capital for investments in American bonds and stocks over several decades has come to an end. As of yesterday, Japan officially lost the status it had maintained since 1991. Germany is now the world's largest creditor.
The Bank of Japan had already started raising interest rates in March 2024, moving from -0.1% to the current 0.5%. As a result, since April, the yield on Japan's 30-year government bonds surged by 100 basis points, reaching a historical high of 3.1%.
On May 19, Japanese Prime Minister Shigeru Ishiba issued a stark warning. He pointed out that government debt levels had become "worse than in Greece," with the debt-to-GDP ratio now standing at an astronomical 260%. This alarming figure could lead Japanese pension funds and insurance companies to reassess their investments in foreign bonds.
If they start offloading US Treasuries en masse, the consequences for the US could be catastrophic. A strong sell-off has already pushed US Treasury yields higher. At times, the 30-year yield has reached 5.15%, the highest level since October 2023. The higher the yield, the more dollars are needed to service the debt. Currently, the US national debt stands at $36.8 trillion, with annual interest expenses of $952 billion.
Donald Trump has repeatedly emphasized that lowering yields is a top priority. However, the levers to achieve this lie solely with the Federal Reserve, not the president. As a result, Trump has frequently lashed out at Fed Chair Jerome Powell, demanding rate cuts in his typically brash manner.
The Federal Reserve has two main options:
But Jerome Powell resists both, fearing that easing could fuel inflation, especially amid America's erratic trade policies. Even if the White House finds a way to pressure the Federal Reserve, it risks further eroding investor confidence. In the past, US Treasuries were considered a haven. Today, they've become a source of anxiety.
The same goes for the US dollar, which the White House now prefers in a weaker form. Dollar depreciation is another potential method to narrow the gap between national debt and the trade deficit. This approach is less overt but theoretically effective. A weaker currency can significantly improve US export competitiveness.
After all, the dollar is "chronically overvalued" in trade terms. According to Stephen Miran, Chair of the Council of Economic Advisers, in his report "A User's Guide to Restructuring the Global Trade System," large-scale tariffs and abandonment of the strong dollar policy could reshape the global trade and financial landscape.

But how much weakening is enough? And how far is Washington willing to go to fully execute this strategy?
So far, the strategy seems to be unfolding as the White House intended. Since the beginning of the year, the dollar has lost nearly 10%, amid growing concerns over US fiscal stability and its waning status as a safe haven.
Still, lessons from Trump's first term show that a 15% drop in the USD may not be enough. Back then, it failed to reduce the deficit, which stubbornly remained at around 3% of GDP.
The conversation has now shifted to a possible devaluation of the US dollar by 20% or even 30%. According to several analysts, only such figures might be enough to eliminate the trade deficit. The US has tried to close the deficit through dollar depreciation many times in recent history, but so far, none of these attempts have succeeded without triggering a recession.
In the 1980s, the deficit was erased thanks to the Plaza Accord and a nearly 50% drop in the dollar's value. But in the 2000s, despite a 40% devaluation, the deficit actually worsened, hitting 6% of GDP in 2005. It wasn't until the Great Recession of 2008–2009, which drastically slashed imports, that the deficit began to shrink.
In short, large dollar drops are rare and often bring unpredictable consequences for global trade. Moreover, the exchange rate alone is insufficient as a corrective tool. Addressing the fundamental imbalance in trade requires a combination of measures, including:
So, can the trade deficit really disappear? According to hedge fund manager Andreas Steno Larsen, a 20–25% fall in the dollar would be enough to automatically eliminate the deficit. Peter Hooper, an analyst at Deutsche Bank, believes that a 20–30% drop in the greenback could cut the deficit by around 3% of GDP. For reference, in 2024, the US trade deficit stood at 3.1% of GDP.
"This suggests that a meaningful reversal of the roughly 40% real appreciation of the dollar against a broad basket of currencies since 2010 may be enough to bring the current deficit back to balance," Hooper explained.
Even though a weaker dollar would likely come at the cost of a major US economic downturn, possibly even a recession, the US government appears willing to take that risk.
May 29, 2:30 AM / Japan /***/ Consumer Confidence Index for May /
Previous: 34.1 pts / Actual: 31.2 pts / Forecast: 31.8 pts / USD/JPY – down
Consumer confidence in Japan continued to deteriorate in April, with the index falling from 34.1 to 31.2 points, reaching its lowest level since February 2023. This marks the fifth consecutive month of decline. All components of the index showed increasing pessimism:
The drop in consumer sentiment points to persistent weakness in domestic demand and could put downward pressure on the yen. While the May forecast suggests a partial recovery to 31.8 points, confirming this trend may temporarily support the Japanese currency, but the overall outlook remains cautious.
May 29, 15:30 / USA /* Q1 GDP Growth Rate / Prev.: 3.1% / Actual: 2.4% / Forecast: -0.3% / USDX (6-currency USD index) – Down**
According to preliminary data, the US economy may have contracted by -0.3% in Q1 2025, marking the first decline since early 2022. This turnaround contrasts with 2.4% growth in Q4 2024 and reflects the impact of the latest wave of trade barriers. Fears over tariffs triggered a sharp increase in imports—up to 41.3%—as businesses and consumers rushed to stock up, putting pressure on the trade balance. Consumer spending growth slowed to 1.8%, while federal spending plunged 5.1%. The only bright spot came from capital investments, which rose 7.8%. Expectations of a downturn could weaken the dollar, especially if this preliminary, strongly negative estimate is confirmed.
May 29, 15:30 / US /* Q1 GDP Price Index / Prev.: 1.9% / Actual: 2.3% / Forecast: 3.7% / USDX – Up**
Meanwhile, the so-called US GDP deflator is expected to rise significantly—from 2.3% to 3.7%—according to preliminary estimates. This would be a very notable acceleration in price growth amid trade-related chaos. The trend points to sustained inflationary pressure despite a cooling economy. An increase in the deflator may be seen by the market as a reason for the Fed to maintain cautious rhetoric and could support the dollar, especially as GDP growth slows.
May 29, 15:30 / US / Jobless Claims (weekly) / Prev.: 229K / Actual: 227K / Forecast: 230K / USDX – Down**
Initial jobless claims in the US for the week ending May 17 fell to 227K, lower than expected and the lowest level in four weeks. This trend points to a resilient labor market despite high interest rates and lingering economic uncertainty. However, continuing claims rose by 36K to 1.903 million, indicating challenges in reemployment. Of particular note were claims from federal employees, which increased by 157 to 595 amid ongoing government layoffs. Moderately positive jobless data may offer some local support for the dollar.
May 29, 17:00 / US / Pending Home Sales (April) / Prev.: -3.6% / Actual: -0.6% / Forecast: 1.9% / USDX – Up**
Pending home sales in the US declined by 0.6% YoY in March 2025. However, the rate of decline was far less than expected. Against the backdrop of a complicated economic environment, this decrease is being seen as a sign of stabilization in the housing market. Forecasts suggesting the indicator could soon turn positive may be interpreted as a trend reversal signal, offering support for the dollar, especially when compared to weakening performance in other sectors.
May 29, 19:00 / US / Crude Oil Inventories (EIA) / Prev.: +3.454M barrels / Actual: +1.328M / Forecast: +0.109M / Brent – Up**
US commercial crude oil inventories rose by 1.328 million barrels for the week ending May 16, way above expectations but notably lower than the previous reporting period. Gasoline and distillate inventories also rose, but moderately. Should future data show a reduction in US crude reserves, oil prices could rise further.
May 30, 02:30 / Japan / Tokyo CPI (May) / Prev.: 2.9% / Actual: 3.5% / Forecast: 3.6% / USD/JPY – Down**
Consumer price inflation in Tokyo accelerated to 3.5% in April, well above the previous reading of 2.9%, indicating growing inflationary pressure in Japan's economy. Despite being slightly below the forecast, the trend confirms persistent price momentum, especially relevant for Bank of Japan policy. Sustained inflation reduces the yen's appeal as a safe-haven currency and may strengthen internal calls to revise current monetary policy. Even a modest rise in inflation, as reported, is likely to be interpreted as a potential argument for policy tightening, giving the yen room to strengthen.
May 30, 2:50 / Japan // April Retail Sales Growth / Prev.: 1.3% / Actual: 3.1% / Forecast: 2.9% / USD/JPY – up** Annual retail sales growth in Japan reached 3.1% in March, exceeding the previous month's figure and approaching the forecast. This marked the 36th consecutive month of retail sector growth. Key drivers included increases in sales of:
However, a local pullback to 2.9% is expected in April, which may put moderate pressure on the yen.
May 30, 2:50 / Japan // April Industrial Production Growth / Prev.: 0.1% / Actual: 1.0% / Forecast: 0.5% / USD/JPY – up**
As with the industrial sector report, Japan's industrial production rose by 1% year-on-year in March, beating both prior figures and market expectations. The data signals a recovery in the manufacturing sector despite weak global demand and export uncertainty. Still, April is projected to see the figure halve from 1% to 0.5%. Another blow to the yen.
May 30, 4:30 / Australia // April Building Permits Change (m/m) / Prev.: -0.2% / Actual: -8.8% / Forecast: 3.1% / AUD/USD – up**
Australia's construction sector data signals risks to domestic activity. In March, the number of building permits issued fell 8.8% from February, hitting a 6-month low. It was the sharpest drop since June 2023 and marked a second consecutive decline. The downturn was seen in both private houses and other residential projects. Given such weak data, the April forecast of 3.1% seems optimistic. Confirmation could serve as a positive signal for the Australian dollar.
May 30, 9:00 / Germany /*/ April Retail Sales Growth / Prev.: 4.3% / Actual: 2.2% / Forecast: 2.4% / EUR/USD – up**
German retail is showing a positive but restrained trajectory. March sales rose by 2.2% YoY, significantly lower than February's jump. Despite ongoing recovery from the 2023 downturn, growth remains moderate, with inflationary pressure and weak consumer sentiment continuing to restrain demand. The April forecast stands at 2.4%. Meeting this would signal stabilization in consumer activity in Germany—a supportive factor for the euro.
May 30, 15:00 / Germany /*/ May Consumer Inflation (Preliminary) / Prev.: 2.2% / Actual: 2.1% / Forecast: 2.0% / EUR/USD – down**
Harmonized German inflation for April came in at 2.1%, marking the lowest level since October last year. Energy prices continued to decline, and food inflation slowed. However, services again became a source of price pressure, with core inflation rising to 2.9%, pointing to persistent internal inflation drivers. The May forecast projects a further slowdown to 2.0%. Confirmation may increase pressure on the euro.
May 30, 15:30 / Canada // Q1 GDP Growth / Prev.: 2.2% / Actual: 2.6% / Forecast: 0.6% / USD/CAD – up**
Canada's economy grew by 2.6% YoY in Q4 2024—the strongest result since early 2023. Steady consumption and recovering investment activity exceeded both revised prior data and market forecasts. However, Q1 2025 is expected to see significant deceleration to 0.6%. Confirmation may pressure the Canadian dollar.
May 30, 15:30 / USA /*/ April Personal Income Growth (m/m) / Prev.: 0.7% / Actual: 0.5% / Forecast: 0.3% / USDX – down**
US personal incomes grew by 0.5% in March, down from 0.7% in February, confirming a deceleration in household earnings. Moderate growth was supported by consistent gains in wages and compensation, rental income, and capital income (dividends, interest). The April forecast is even lower (0.3%). Confirmation would signal weakening consumer potential and pressure the dollar.
May 30, 15:30 / USA /*/ April Personal Spending Growth (m/m) / Prev.: 0.5% / Actual: 0.7% / Forecast: 0.2% / USDX – down**
US consumer spending rose by 0.7% MoM in March, accelerating from February. Key drivers included vehicle purchases and stronger demand for services, from dining to healthcare. Despite March's activity, April is forecast to slow to just 0.2%. If confirmed, it could weaken the dollar amid ongoing inflation risks and Fed policy uncertainty.
May 30, 15:30 / USA /*/ April PCE Price Index / Prev.: 2.7% / Actual: 2.3% / Forecast: 2.2% / USDX – down**
US PCE inflation for March fell to 2.3%, the lowest in five months. If April's reading hits the forecasted 2.2%, markets may take it as further evidence of price stabilization, reducing the odds of hawkish Fed rhetoric—bearish for the dollar. However, any upside surprise would be seen as a warning signal and favor sustained high interest rates.
May 30, 16:45 / USA // May Chicago Business Activity Index / Prev.: 47.6 / Actual: 44.6 / Forecast: 45.1 / USDX – up**
Chicago's business activity index fell to 44.6 in April—the weakest in three months and the 17th consecutive contraction. Drops in orders and production point to continued sectoral weakness. Rising inventories likely reflect stockpiling amid tariff risks. Producer prices surged to the highest level since August 2022. Respondents cited abrupt shifts in US trade policy. The May forecast of 45.1 could signal stabilization and support the dollar.
May 30, 17:00 / USA // May Consumer Sentiment (University of Michigan) / Prev.: 57.0 / Actual: 52.2 / Forecast: 50.8 / USDX – down**
The University of Michigan's consumer sentiment index is forecast at 50.8 for May, the lowest since June 2022. Both components are deteriorating:
Falling confidence reflects concerns over trade policy, prices, and weakening real incomes, dragging the dollar lower.
May 31, 4:30 / China /*/ May Manufacturing PMI / Prev.: 50.5 / Actual: 49.0 / Forecast: 49.5 / USD/CNY – down, Brent – up**
China's manufacturing PMI fell to 49 in April—the lowest since December. It was the first contraction in four months, signaling fragile recovery. Weak new and export orders highlight rising trade tensions with the US employment and purchasing also declining, while price indices dropped at the fastest pace in seven months. Business confidence fell to a 7-month low. However, the May forecast sees a mild recovery to 49.5. If confirmed, it could slightly boost the yuan and support oil prices.
MobileTrader: trading platform near at hand!
Download and start right now!
You have already liked this post today
*Disclaimer: The market analysis posted here is meant to increase your awareness, but not to give instructions to make a trade.
 If you have any content questions, please contact editorial-board@instaforex.com


