empty
 
 
06.11.2025 10:21 AM
Wall Street overheated due to excess investors' optimism

Overheating is the best term to describe the situation in the US stock market at the beginning of November. Following an explosive jump of more than 40% from the April lows, the S&P 500 has pulled back. The broad market index weighs the pros and cons of continuing its upward march. The artificial intelligence sector is a powerful bullish driver, but much of its potential has already been factored into prices. Moreover, investors are plagued by doubts about whether the massive investments in AI will yield satisfactory returns.

This image is no longer relevant

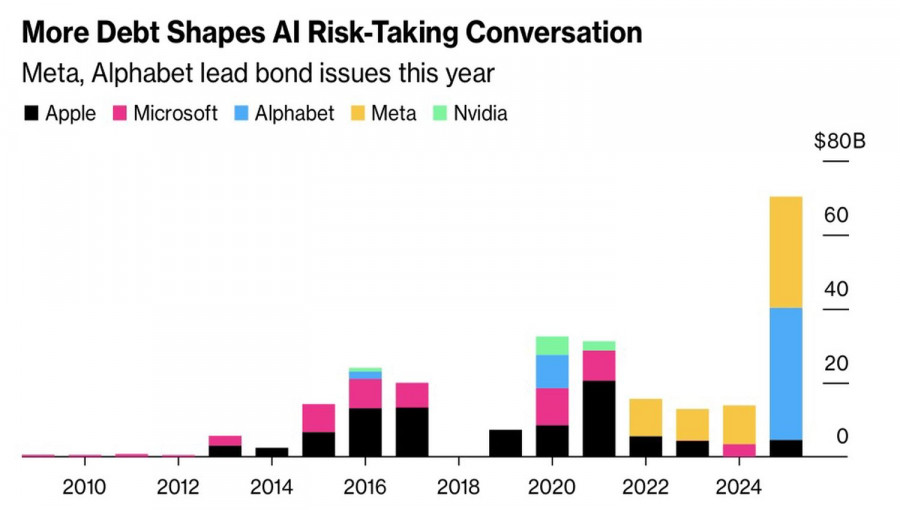
Dynamics of AI investment loans

From a fundamental viewpoint, the S&P 500 is clearly overvalued. Today's stock market bears similarities to the early 2000s, when internet companies soared only to meet a tragic end. All bubbles burst with a bang, yet there are many bad days when they inflate. In January 2000, the Nasdaq fell by 3% over five trading days, but investors bought the dip, hoping for market perfection. Ultimately, before its crash in March that year, the index had surged by 28%.

In reality, that January peak was a warning signal. The pullback in early November may serve as another warning. The modern stock market is also viewed as a paragon of perfection. Thus, doubts about potential interest rate cuts by the Fed, high fundamental valuations, and rising yields on US Treasury bonds are often overlooked. Nevertheless, signs of overheating are evident.

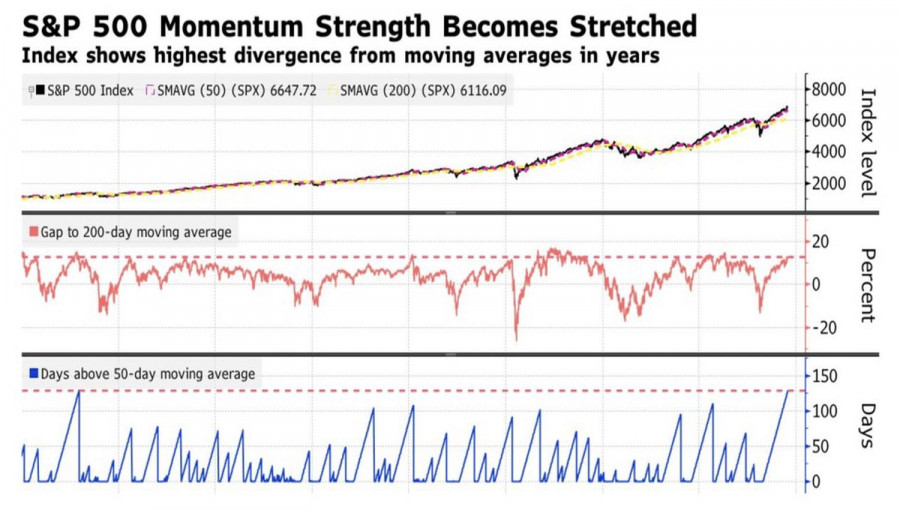
S&P 500 dynamics, gaps with EMA, and duration above EMA

This image is no longer relevant

The gap between the S&P 500 and its 200-day moving average has increased to 13%. Historically, such spreads are unsustainable. Over time, they tend to narrow through corrections. The broad market index has traded above the 50-period EMA for the longest stretch since 2011. While these signs of overheating do not predict an impending pullback, they do prompt investors to stay alert. Doubts are arising in the market regarding the effectiveness of the dip-buying strategy, which has proven successful since April.

This image is no longer relevant

On the other hand, the market continues to find positivity even in the negative. The S&P 500 was not discouraged by the fact that the probability of a federal funds rate cut in December fell from 74% to 62% after the release of strong services sector activity data from ISM and employment figures from ADP. The Fed has a dual mandate, and even if the US economy appears healthy while the labor market cools, the central bank will still look to ease monetary policy.

Technical outlook

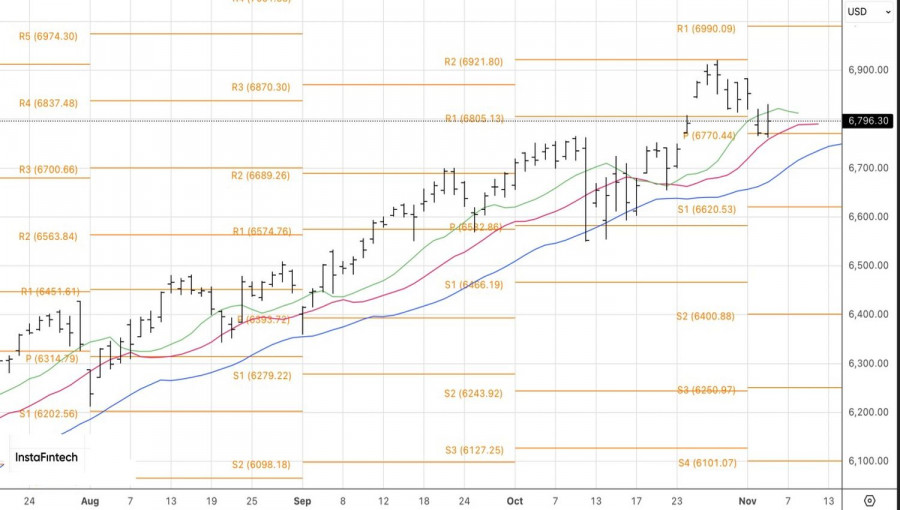
Technically, on the daily chart, the S&P 500 is testing the first of three moving averages that make up Bill Williams' Alligator. A return to the breakout bar's high of 6,830 will serve as a basis for purchases within Linda Raschke's Holy Grail strategy. Conversely, a decline of the broad market index below the pivot level of 6,770 would signal the formation of short positions.

Marek Petkovich,
انسٹافاریکس کا تجزیاتی ماہر
© 2007-2025
Summary
Urgency
Analytic
Igor Kovalyov
Start trade
انسٹافاریکس کے ساتھ کرپٹو کرنسی کی معاملاتی تبدیلیوں سے کمائیں۔
میٹا ٹریڈر 4 ڈاؤن لوڈ کریں اور اپنی پہلی ٹریڈ کھولیں۔
  • Grand Choice
    Contest by
    InstaForex
    InstaForex always strives to help you
    fulfill your biggest dreams.
    مقابلہ میں شامل ہوں
  • چانسی ڈیپازٹ
    اپنے اکاؤنٹ میں 3000 ڈالر جمع کروائیں اور حاصل کریں$5000 مزید!
    ہم نومبر قرعہ اندازی کرتے ہیں $5000چانسی ڈیپازٹ نامی مقابلہ کے تحت
    اپنے اکاؤنٹ میں 3000 ڈالر جمع کروانے پر موقع حاصل کریں - اس شرط پر پورا اُترتے ہوئے اس مقابلہ میں شرکت کریں
    مقابلہ میں شامل ہوں
  • ٹریڈ وائز، ون ڈیوائس
    کم از کم 500 ڈالر کے ساتھ اپنے اکاؤنٹ کو ٹاپ اپ کریں، مقابلے کے لیے سائن اپ کریں، اور موبائل ڈیوائسز جیتنے کا موقع حاصل کریں۔
    مقابلہ میں شامل ہوں
  • 30 فیصد بونس
    ہر بار جب آپ اپنا اکاؤنٹ ٹاپ اپ کریں تو 30 فیصد بونس حاصل کریں
    بونس حاصل کریں

تجویز کردہ مضامین

ابھی فوری بات نہیں کرسکتے ؟
اپنا سوال پوچھیں بذریعہ چیٹ.
Widget callback