empty
 
 
18.07.2025 03:56 AM
Trading Recommendations and Trade Breakdown for EUR/USD on July 18: Calm After the Storm

EUR/USD 5-Minute Analysis

This image is no longer relevant

The EUR/USD currency pair continued to decline on Thursday after an unexpected surge on Wednesday evening. Recall that on Wednesday evening, it became known that Donald Trump again wants to fire Jerome Powell. Although the U.S. president immediately denied the report, he also stated that Powell might resign due to fraud. Frankly, we don't understand how the forex market could react so strongly once again to such news. Trump has already "fired" Powell about ten times — and that's just in 2025. The accusations against Powell related to Fed building renovation expenses seem like outright fabrication. Trump could just as easily accuse Powell of incompetence or even treason — or claim he's an illegal immigrant, as was the case with Elon Musk. The market should already recognize that Trump will employ any necessary methods to achieve his goals.

As for Thursday, there were a few significant events. The final estimate of Eurozone inflation matched the preliminary figure, while U.S. retail sales exceeded expectations — yet this had absolutely no effect on the dollar. Once again in recent weeks, we're seeing the market operate according to its own rules. And right now, those rules are correctional.

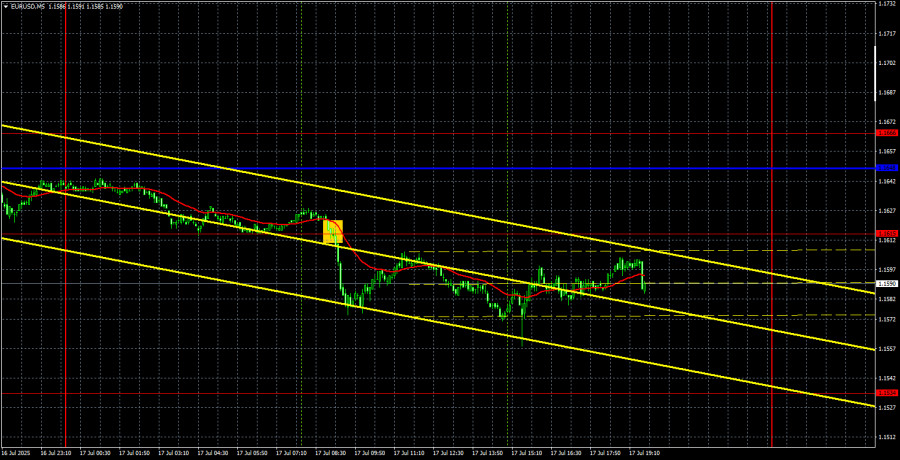
On the 5-minute chart, only one trading signal was formed yesterday. At the start of the European session, the pair consolidated below the 1.1615 level, but it failed to reach the nearest target at 1.1534 by the end of the day. Volatility was low, but traders could still earn a small profit on short positions.

COT Report

This image is no longer relevant

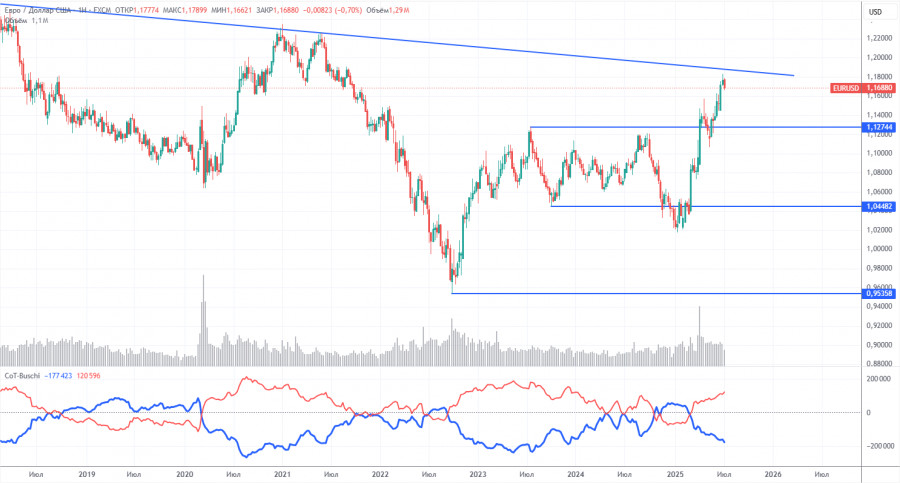
The latest COT report is dated July 8. As shown clearly in the illustration above, the net position of non-commercial traders had long remained "bullish." Bears only briefly gained the upper hand at the end of 2024 but quickly lost it. Since Trump took office as U.S. president, only the dollar has been falling. We cannot say with 100% certainty that the U.S. currency will continue to decline, but the current developments in the world suggest just that.

We still see no fundamental drivers for the euro's strengthening, but there remains one strong factor contributing to the dollar's decline. The global downtrend persists, but does it matter where the price moved over the last 16 years? As soon as Trump ends his trade wars, the dollar might begin to rise again—but will Trump end them? And when?

Currently, the red and blue lines have crossed again, so the trend in the market remains bullish. During the last reporting week, the number of long positions in the "Non-commercial" group increased by 16,100, while short positions increased by 3,100. Thus, the net position grew by 13,000 contracts over the week.

EUR/USD 1-Hour Analysis

This image is no longer relevant

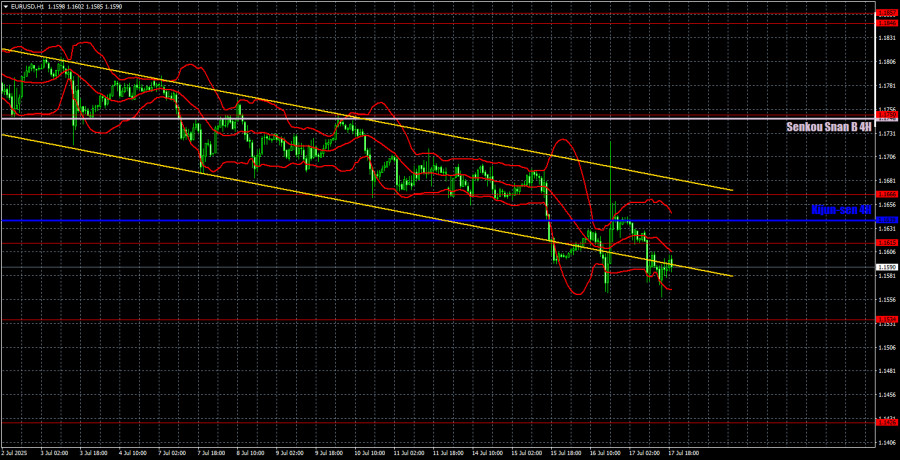
On the hourly chart, EUR/USD remains in a downward trend within a descending channel. Therefore, the dollar may continue to strengthen for a while longer — this downward correction is taking longer than expected. However, Trump's policy remains unchanged. Every other day, we hear about new sanctions, tariffs, and threats against half the world. A consolidation above the channel, and ideally above the Senkou Span B line, would signal the end of the downtrend.

For July 18, we highlight the following trading levels: 1.1092, 1.1147, 1.1185, 1.1234, 1.1274, 1.1362, 1.1426, 1.1534, 1.1615, 1.1666, 1.1750, 1.1846–1.1857, along with the Senkou Span B line (1.1746) and the Kijun-sen line (1.1639). The Ichimoku indicator lines may shift during the day, so keep this in mind when identifying signals. Don't forget to place a Stop Loss at breakeven once the price moves 15 pips in your favor — this will protect you from losses in case of a false signal.

On Friday, no major or interesting events are scheduled in the Eurozone, and in the U.S., only the University of Michigan Consumer Sentiment Index and a few minor reports are expected to be released. These are unlikely to affect overall market sentiment.

Illustration Explanations:

  • Support and resistance price levels – thick red lines where movement may end. They are not trading signal sources.
  • Kijun-sen and Senkou Span B lines—These are strong Ichimoku indicator lines transferred to the hourly timeframe from the 4-hour one.
  • Extremum levels – thin red lines where the price has previously rebounded. These act as trading signal sources.
  • Yellow lines – trend lines, trend channels, and other technical patterns.
  • COT Indicator 1 on the charts – the size of the net position for each category of traders.
Paolo Greco,
انسٹافاریکس کا تجزیاتی ماہر
© 2007-2025
Summary
Urgency
Analytic
Stanislav Polyanskiy
Start trade
انسٹافاریکس کے ساتھ کرپٹو کرنسی کی معاملاتی تبدیلیوں سے کمائیں۔
میٹا ٹریڈر 4 ڈاؤن لوڈ کریں اور اپنی پہلی ٹریڈ کھولیں۔
  • Grand Choice
    Contest by
    InstaForex
    InstaForex always strives to help you
    fulfill your biggest dreams.
    مقابلہ میں شامل ہوں
  • چانسی ڈیپازٹ
    اپنے اکاؤنٹ میں 3000 ڈالر جمع کروائیں اور حاصل کریں$4000 مزید!
    ہم جولائی قرعہ اندازی کرتے ہیں $4000چانسی ڈیپازٹ نامی مقابلہ کے تحت
    اپنے اکاؤنٹ میں 3000 ڈالر جمع کروانے پر موقع حاصل کریں - اس شرط پر پورا اُترتے ہوئے اس مقابلہ میں شرکت کریں
    مقابلہ میں شامل ہوں
  • ٹریڈ وائز، ون ڈیوائس
    کم از کم 500 ڈالر کے ساتھ اپنے اکاؤنٹ کو ٹاپ اپ کریں، مقابلے کے لیے سائن اپ کریں، اور موبائل ڈیوائسز جیتنے کا موقع حاصل کریں۔
    مقابلہ میں شامل ہوں
  • 100 فیصد بونس
    اپنے ڈپازٹ پر 100 فیصد بونس حاصل کرنے کا آپ کا منفرد موقع
    بونس حاصل کریں
  • 55 فیصد بونس
    اپنے ہر ڈپازٹ پر 55 فیصد بونس کے لیے درخواست دیں
    بونس حاصل کریں
  • 30 فیصد بونس
    ہر بار جب آپ اپنا اکاؤنٹ ٹاپ اپ کریں تو 30 فیصد بونس حاصل کریں
    بونس حاصل کریں

تجویز کردہ مضامین

ابھی فوری بات نہیں کرسکتے ؟
اپنا سوال پوچھیں بذریعہ چیٹ.
Widget callback