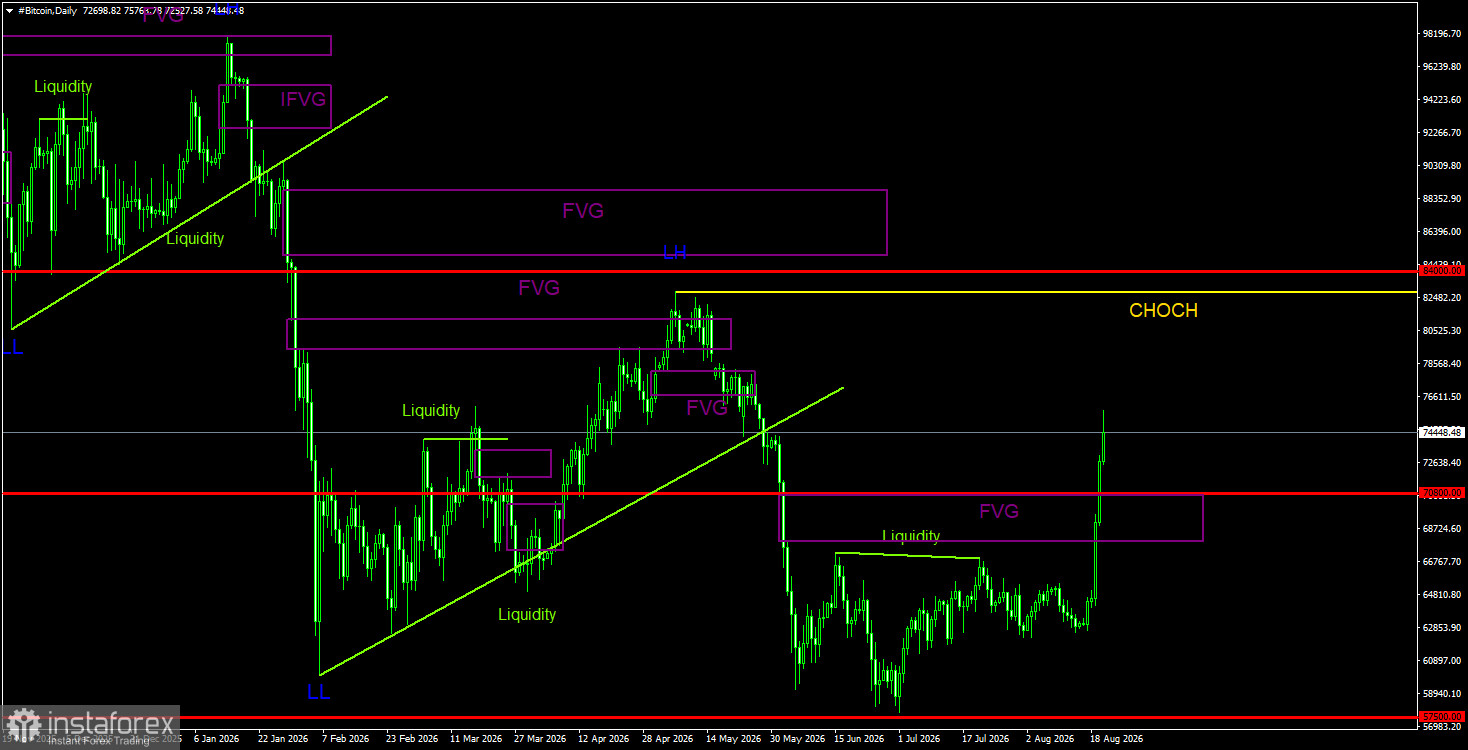
Bitcoin has surged by $12,000 this week, leaving many astonished. Even traders who anticipated a new bullish trend likely did not expect such a sharp and unexpected rise. As a result, Bitcoin reached the only area of POI in the form of a bearish FVG after two months of stagnation and effortlessly broke through it. A sell signal was not formed; thus, the FVG pattern is now transforming into an IFVG pattern. This indicates a bullish pattern supporting the upward movement.
We still allow for the possibility that the current rise of "digital gold" is part of a correction or even a manipulation by market makers aimed at demonstrating to the market that a new bullish trend is beginning. Interestingly, there are no solid reasons for a new bullish trend at this time. Yes, the US Treasury's actions this week triggered a significant rise in risk assets, but how much can they appreciate based solely on this factor? The fundamental backdrop remains negative for the cryptocurrency segment: the Federal Reserve does not intend to lower the key interest rate in 2026, capital continues to flow into the AI sector, spot demand for Bitcoin remains weak, geopolitical stability is lacking, miners are repurposing their equipment for AI needs, and strategy continues to sell Bitcoin reserves.
On Wednesday, the US Treasury announced it would double the buyback of old long-term bonds. This news led to a sharp drop in the dollar and a rise in risk assets. Essentially, the government's bond buybacks are a form of quantitative easing (QE). The Treasury removes bonds from the market in exchange for injecting liquidity (money) into the economy. As more money enters the system, it begins to flow into other investment instruments, such as cryptocurrencies or stocks. We acknowledge that this is a strong growth factor that could not have been predicted in advance. Unfortunately, nobody can know the Treasury's plans in advance. But can Bitcoin rise back to $120,000 or even higher based solely on this factor? This week, the technical picture for the leading cryptocurrency became much more favorable; however, the CHOCH line has not been breached, and there is a downward trend on the weekly timeframe. For Bitcoin, the only support currently comes from the Treasury's decision. However, bullish patterns can now be taken more seriously.
Overall Picture of BTC/USD on 1D
On the daily timeframe, Bitcoin continues to form a downward trend. The trend structure is bearish, and the CHOCH line is at $82,800, where the last LH (Lower High) formed. Only above this level can we consider the downward trend to be complete. The last and only bearish FVG has been fully breached, transforming into a bullish IFVG. Thus, this will now become a POI for long positions. Bitcoin has yet to break the downward trend, but in recent days, the chances of completing the bearish trend have sharply increased. This cannot be overlooked.
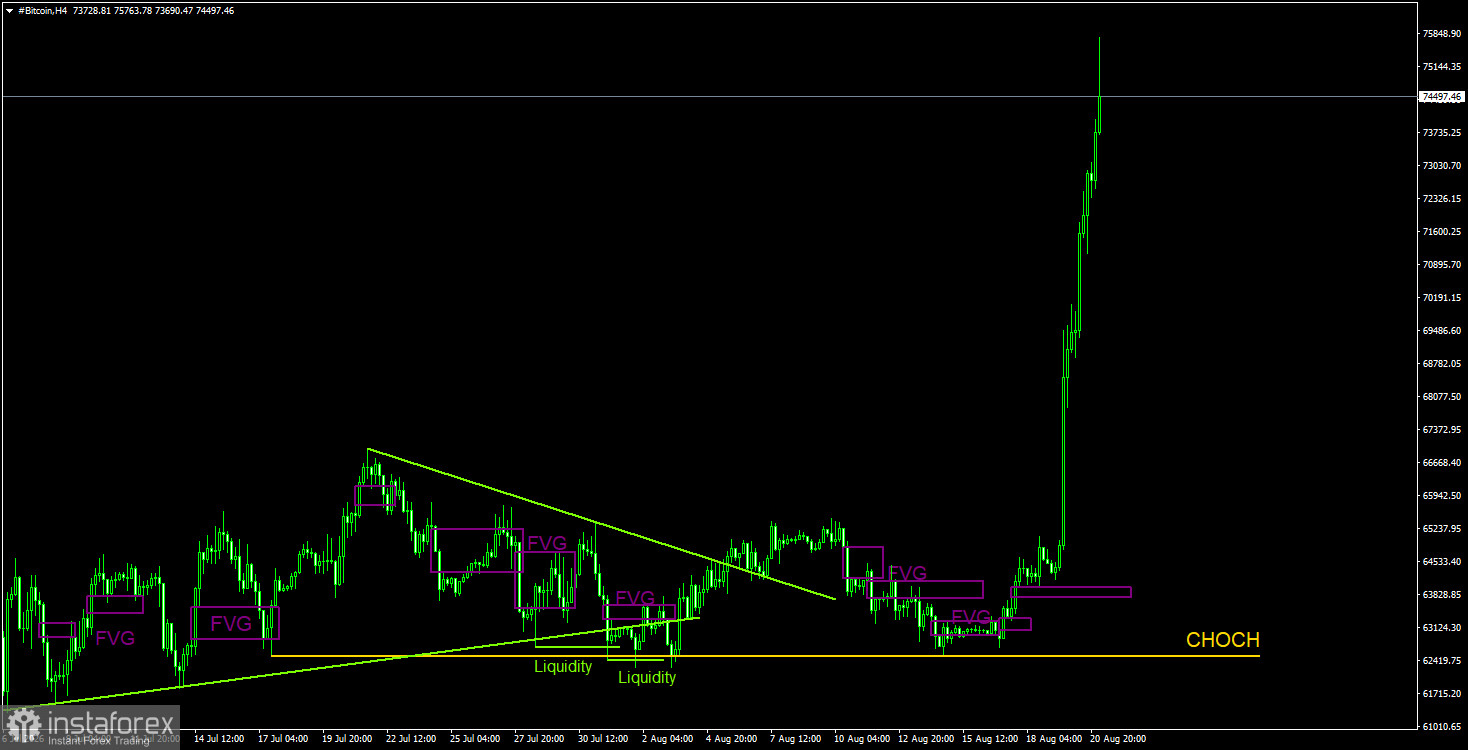
Overall Picture of BTC/USD on 4H
On the 4-hour timeframe, it is clearly visible how Bitcoin has literally soared into the stratosphere. Analyzing the 4-hour timeframe at this moment is not particularly useful, as the movements are too strong. Therefore, trading signals should be sought on the daily timeframe or even on the weekly timeframe in the coming days.
Trading Recommendations for BTC/USD:
Bitcoin continues to form a downward trend, despite this week's strong surge. We continue to expect a decline targeting $57,500 (the 61.8% level on the Fibonacci retracement from the three-year upward trend), although this level has essentially already been worked out. However, we do not believe that the downward trend will finish here. The last bearish FVG pattern has been canceled, and there are essentially no POIs for short positions on higher timeframes. However, a bearish FVG can still be distinguished on the weekly timeframe, while the downward trend on the daily chart has not been overturned, and the fundamental background is not clear enough to expect a rise in the cryptocurrency to its ATH.
Explanations for Illustrations:
- CHOCH – break of a trend structure.
- Liquidity – Stop-loss and pending orders that market makers use to build their positions.
- FVG – Fair Value Gap. The price passes through these areas very quickly, indicating a complete absence of one side in the market. Subsequently, the price tends to return to and respond to such areas in continuation of the main trend.
- IFVG – Inverted Fair Value Gap. After returning to such an area, the price does not receive a reaction and impulsively breaks through it, then tests it from the other side.
- OB – Order Block. The candle on which the market maker opened a position to collect liquidity for forming their position in the opposite direction.