Analysis of Tuesday's Trades
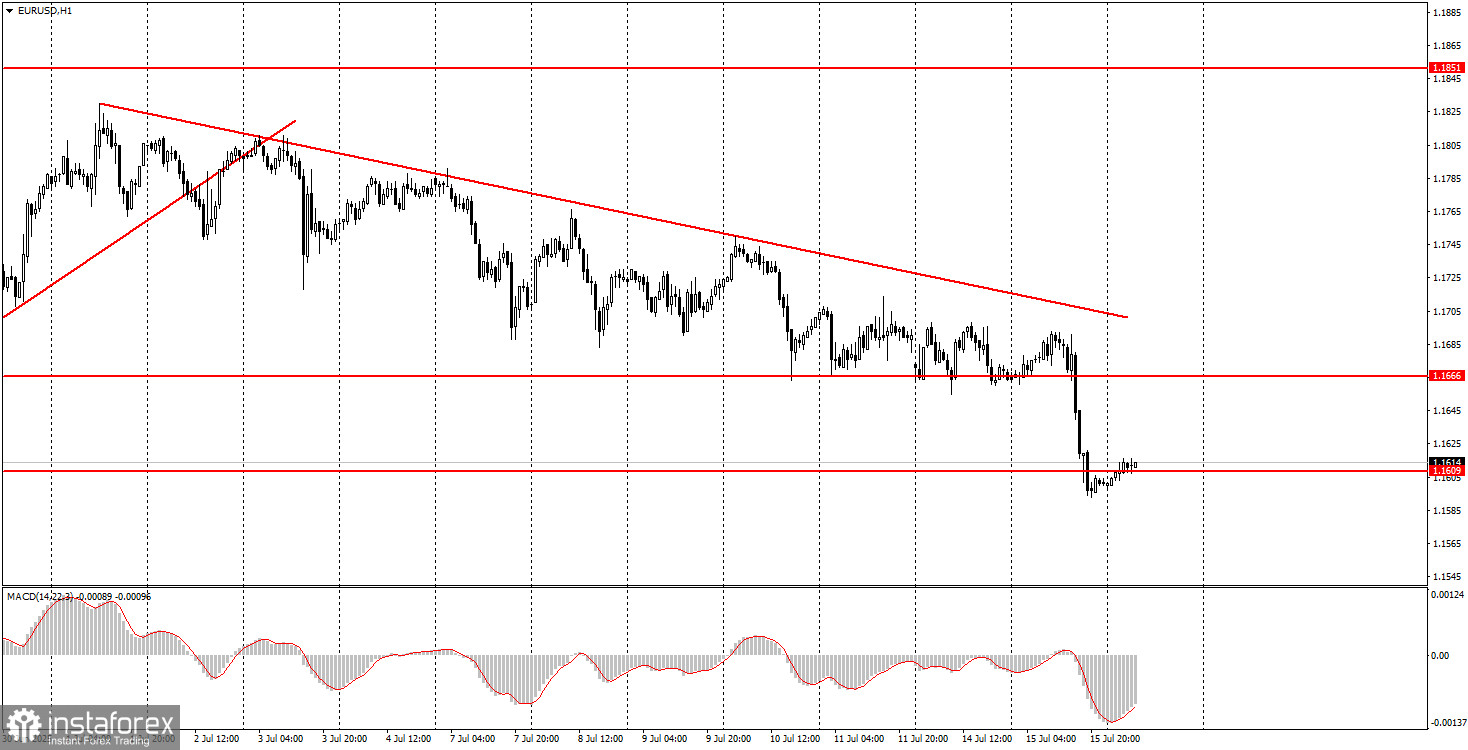
1H Chart of EUR/USD
The EUR/USD currency pair plunged sharply on Tuesday following the release of the U.S. inflation report. As the saying goes, nothing foretold trouble. For several days in a row, traders failed to break through the 1.1666 level, and they didn't seem particularly eager to try. However, a routine inflation report triggered a sharp rise in the dollar. Why?
Headline inflation in the U.S. rose to 2.7% in June, entirely in line with forecasts. Core inflation accelerated to 2.9%, which was actually below expectations. Thus, overall, inflation increased less than expected. But since it still rose, the likelihood of a Federal Reserve rate cut in the near future is essentially zero, which is indeed a bullish factor for the U.S. dollar.
That said, this bullish factor has already been in place for six months, as the Fed has not resumed and does not plan to resume monetary easing. Tuesday's inflation report did not change the Fed's stance in any way. Therefore, from our perspective, this remains a purely technical correction, with the market simply using a formal excuse for selling.
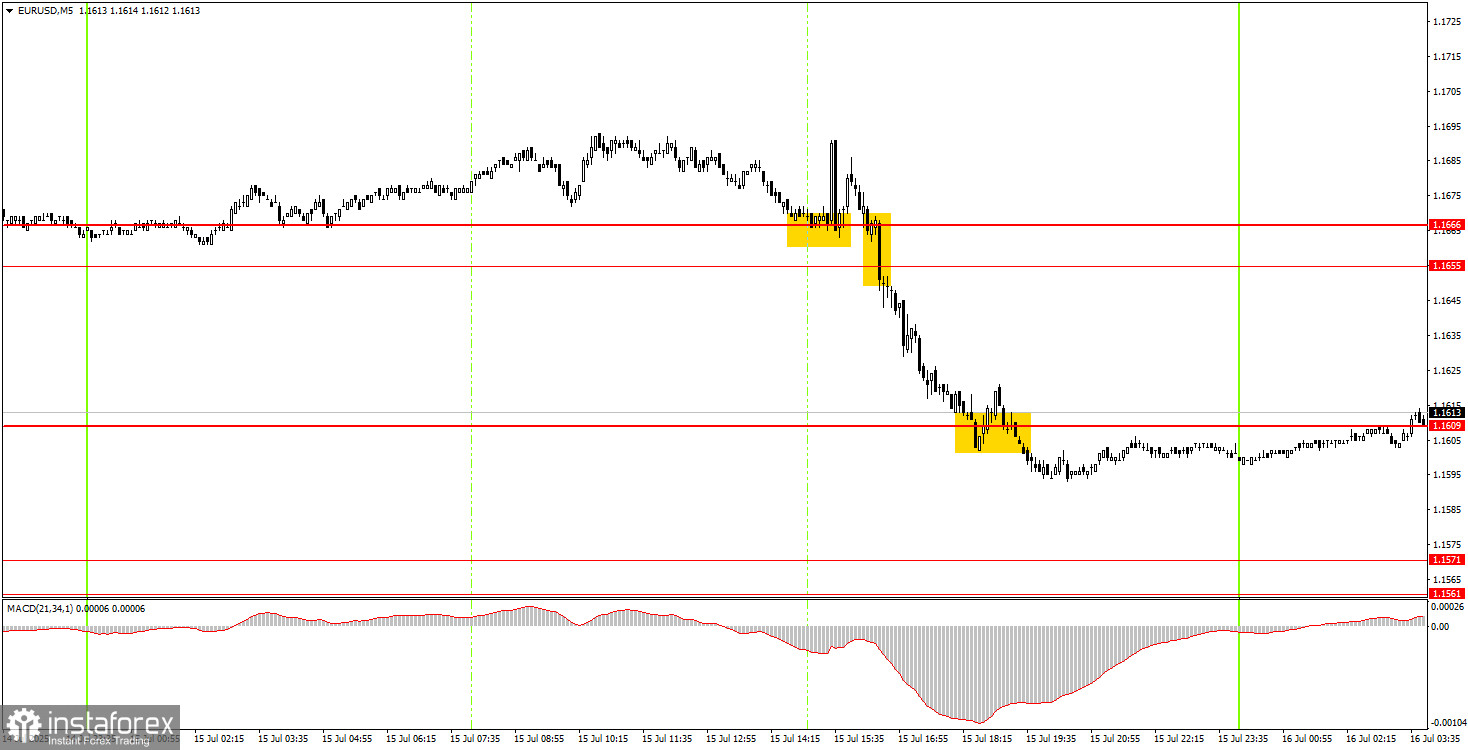
5M Chart of EUR/USD
In the 5-minute timeframe, several trading signals formed on Tuesday. We believe none of them should have been acted upon. During the publication of the U.S. inflation report, the market turned jittery, and we observed "whipsaw" movements. Ultimately, the pair consolidated below the 1.1655–1.1666 zone, but the expectation of dollar growth on inflation data—especially given the market's calm reaction to positive labor market, business activity, and unemployment reports just two weeks earlier—still feels questionable.
Trading Strategy for Wednesday:
On the hourly chart, the EUR/USD pair continues a correction, but the six-month-long uptrend remains intact. We do not believe this marks the end of the dollar's decline. The dollar has been weakening for six months and is currently in a correction. Trump's policies have not reversed 180 degrees to justify a new bullish phase for the U.S. currency.
On Wednesday, EUR/USD may continue its decline, as the trend on the hourly chart is bearish. We still see no fundamental reasons to buy the dollar, but the market apparently does. Most likely, this is just a typical profit-taking phase on long positions.
On the 5-minute chart, watch the following levels: 1.1198–1.1218, 1.1267–1.1292, 1.1354–1.1363, 1.1413, 1.1455–1.1474, 1.1527, 1.1561–1.1571, 1.1609, 1.1655–1.1666, 1.1740–1.1745, 1.1808, 1.1851, 1.1908.
No important events are scheduled for the Eurozone on Wednesday, while the U.S. will only release the Producer Price Index (PPI) and Industrial Production figures. These are not major reports, so volatility may remain low. If the U.S. dollar strengthens again today, it would only reinforce our view that the current movement is correctional.
Core Trading System Rules:
- Signal Strength: The shorter the time it takes for a signal to form (a rebound or breakout), the stronger the signal.
- False Signals: If two or more trades near a level result in false signals, subsequent signals from that level should be ignored.
- Flat Markets: In flat conditions, pairs may generate many false signals or none at all. It's better to stop trading at the first signs of a flat market.
- Trading Hours: Open trades between the start of the European session and the middle of the US session, then manually close all trades.
- MACD Signals: On the hourly timeframe, trade MACD signals only during periods of good volatility and a clear trend confirmed by trendlines or trend channels.
- Close Levels: If two levels are too close (5–20 pips apart), treat them as a support or resistance zone.
- Stop Loss: Set a Stop Loss to breakeven after the price moves 15 pips in the desired direction.
Key Chart Elements:
Support and Resistance Levels: These are target levels for opening or closing positions and can also serve as points for placing Take Profit orders.
Red Lines: Channels or trendlines indicating the current trend and the preferred direction for trading.
MACD Indicator (14,22,3): A histogram and signal line used as a supplementary source of trading signals.
Important Events and Reports: Found in the economic calendar, these can heavily influence price movements. Exercise caution or exit the market during their release to avoid sharp reversals.
Forex trading beginners should remember that not every trade will be profitable. Developing a clear strategy and practicing proper money management are essential for long-term trading success.