EUR/USD 5-Minute Analysis
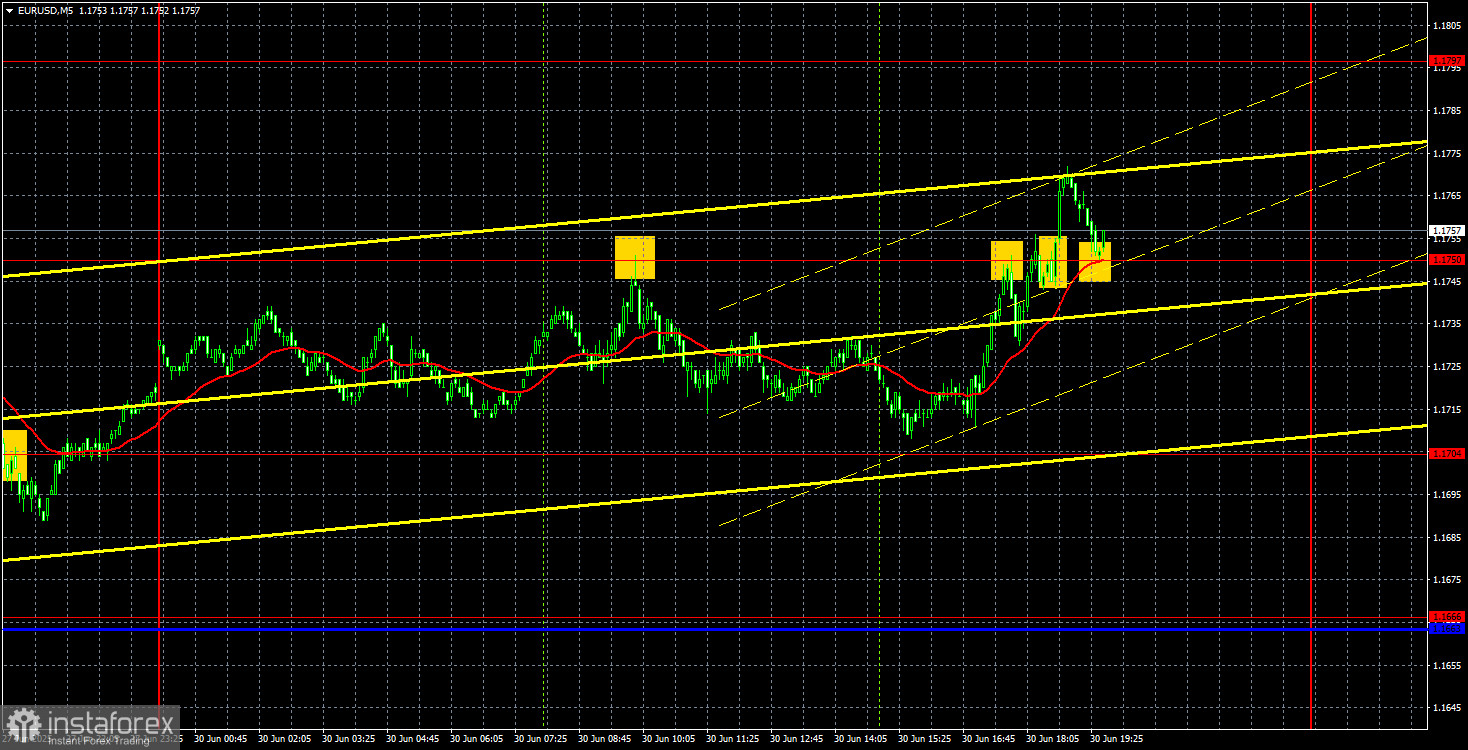
Throughout Monday, the EUR/USD currency pair essentially remained flat, repeatedly attempting to resume its upward trend. Despite a weak macroeconomic and fundamental backdrop on both Friday and Monday, the U.S. dollar failed to even slightly correct upwards. This continues to indicate one thing only — its decline is set to continue, as there are simply no traders in the market willing to buy the U.S. currency. Thus, breaking through the 1.1750 level will open the way toward 1.1805. A move beyond 1.1805 would clear the path to the 1.1846–1.1857 area. You can't escape fate.
There was a macroeconomic background on Monday, but it wasn't the reason for the dollar's inability to gain value. In the morning, Germany released its retail sales report, which once again came in significantly below expectations. Later, it was reported that inflation in Germany fell to 2%, increasing the likelihood of another ECB key rate cut. However, as we can see, neither the European Central Bank's dovish stance nor weak macroeconomic data have put any pressure on the euro. It continues to rise.
Monday's volatility was weak. Two sell signals formed around the 1.1750 level. In the first case, the price dropped by around 30 pips and nearly hit the nearest target at 1.1704, missing it by just a few pips. The second rebound was very weak, and the price then began a gradual movement through the 1.1750 level. This buy signal could also have been executed. Many important events and reports are scheduled for this week. The dollar will have a chance. However, a strong rally still seems unlikely.
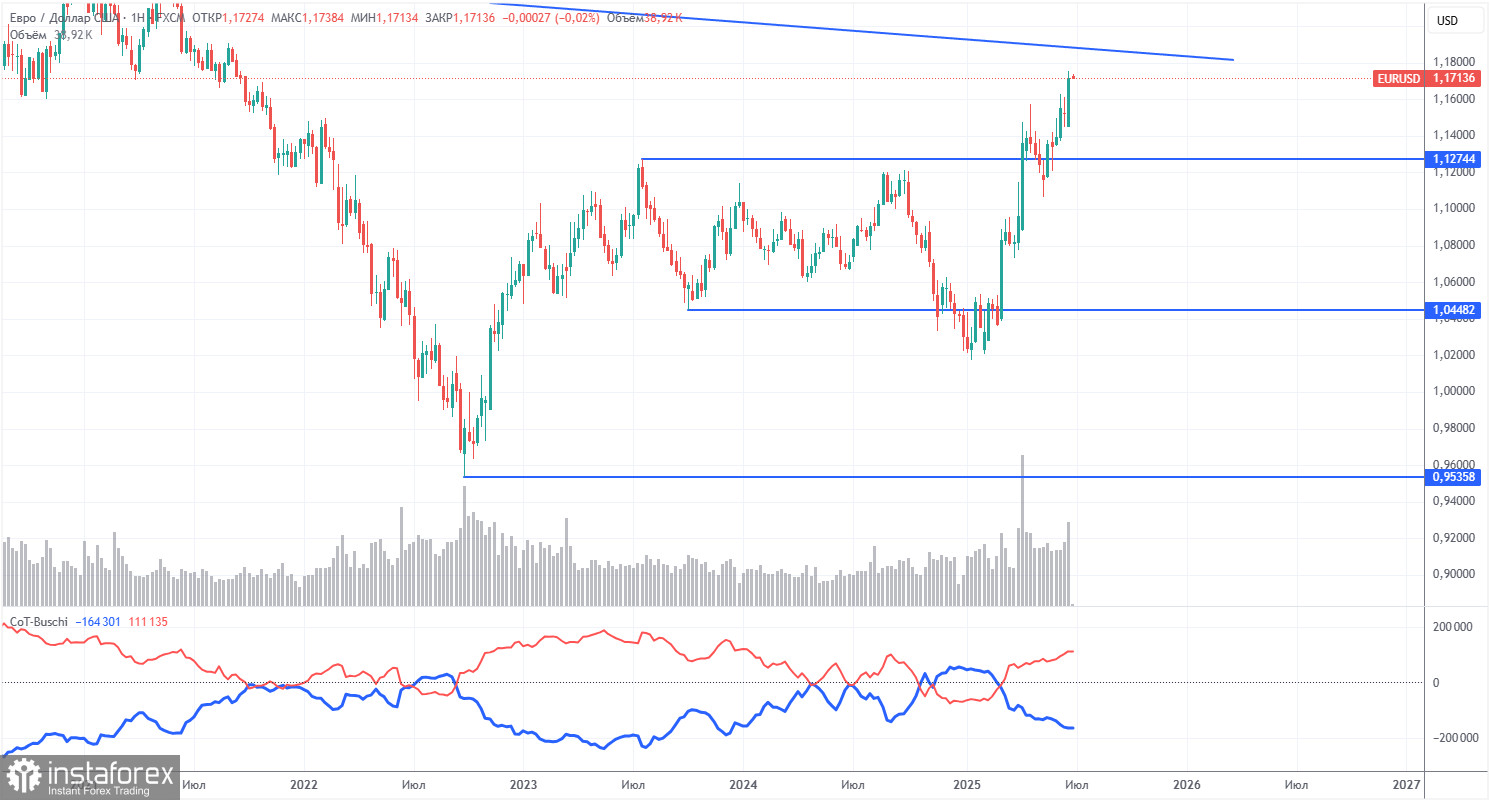
COT Report
The latest COT report is dated June 24. As clearly shown in the illustration above, the net position of non-commercial traders had been "bullish" for a long time. Bears barely gained the upper hand by the end of 2024 but quickly lost that advantage. Since Trump assumed the presidency, only the dollar has been falling. We cannot say with 100% certainty that the decline will continue, but current global developments suggest that it may very well do so.
We still see no fundamental reasons for the euro to strengthen — but there is one strong reason for the dollar to fall. The global downtrend remains in place. But at this point, does it matter where the price moved over the past 16 years? Once Trump ends his trade wars, the dollar might begin to recover — but will Trump ever end them? And when?
Currently, the red and blue lines have crossed again, which means the market trend has once again turned bullish. During the last reporting week, the number of long positions in the non-commercial group increased by 3,000 contracts, while the number of short positions decreased by 6,600. As a result, the net position increased by 9,600 contracts over the week.
EUR/USD 1-Hour Analysis
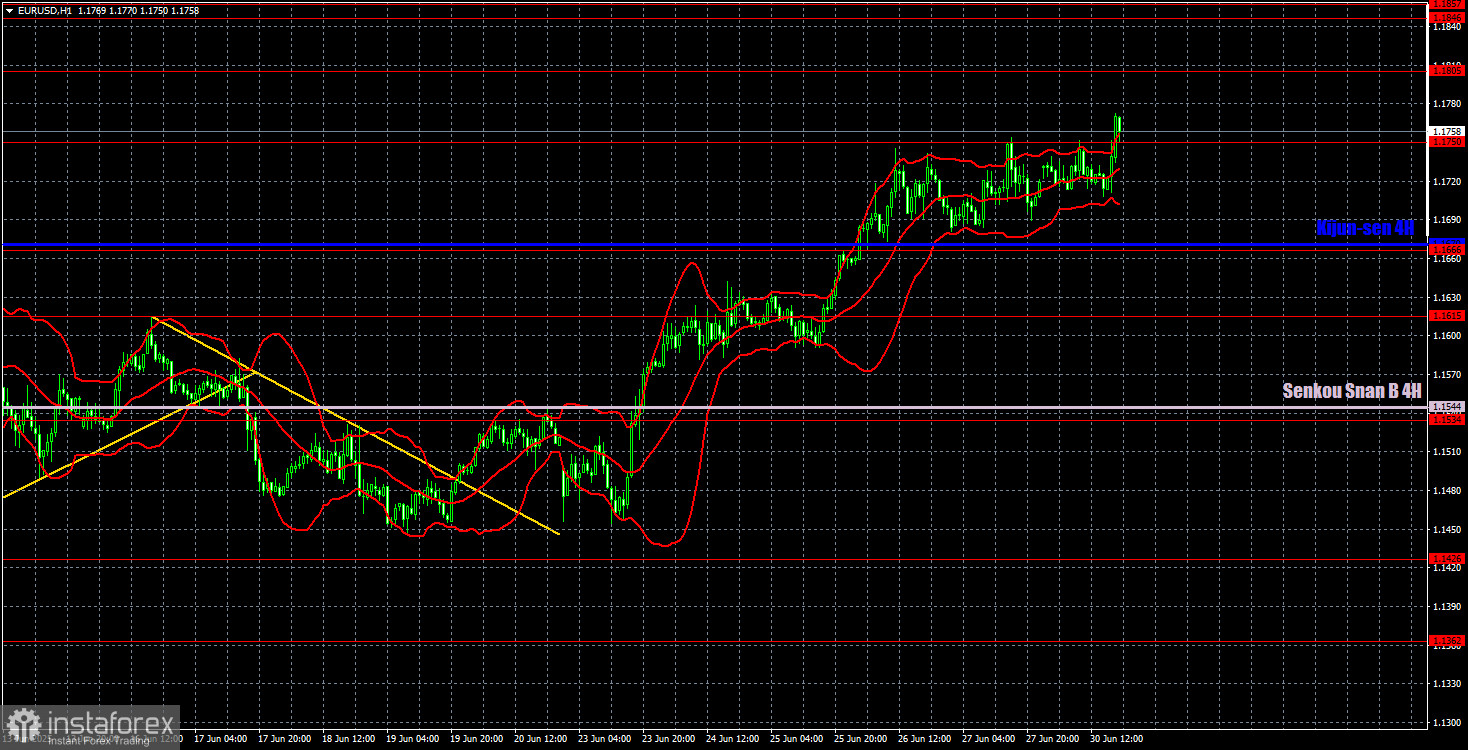
On the hourly timeframe, EUR/USD continues forming a new upward trend, with movement remaining uninterrupted by any pullbacks. A steady stream of negative information from the U.S. continues to push traders to dump the dollar — and this information now extends beyond the economy. It concerns the future of the United States. The dollar has been declining for five consecutive months, losing 1,500 pips during that time without triggering any significant correction.
For July 1, we identify the following trading levels: 1.1092, 1.1147, 1.1185, 1.1234, 1.1274, 1.1362, 1.1426, 1.1534, 1.1615, 1.1666, 1.1750, 1.1805, 1.1846–1.1857, as well as the Senkou Span B line (1.1544) and the Kijun-sen line (1.1670). Ichimoku indicator lines may shift throughout the day and should be taken into account when identifying trading signals. Don't forget to place your Stop Loss at breakeven once the price moves 15 pips in the desired direction. This helps protect against potential losses in case of a false signal.
On Tuesday, the EU will publish inflation and manufacturing sector PMI data. In the U.S., the ISM index and Jerome Powell's speech are scheduled. We do not expect any major statements from Powell or Lagarde, but the ISM index could trigger a response from traders. The dollar will likely continue its decline.
Illustration Explanations:
- Support and resistance price levels – thick red lines where movement may end. They are not trading signal sources.
- Kijun-sen and Senkou Span B lines—These are strong Ichimoku indicator lines transferred to the hourly timeframe from the 4-hour one.
- Extremum levels – thin red lines where the price has previously rebounded. These act as trading signal sources.
- Yellow lines – trend lines, trend channels, and other technical patterns.
- COT Indicator 1 on the charts – the size of the net position for each category of traders.