EUR/USD 5-Minute Analysis
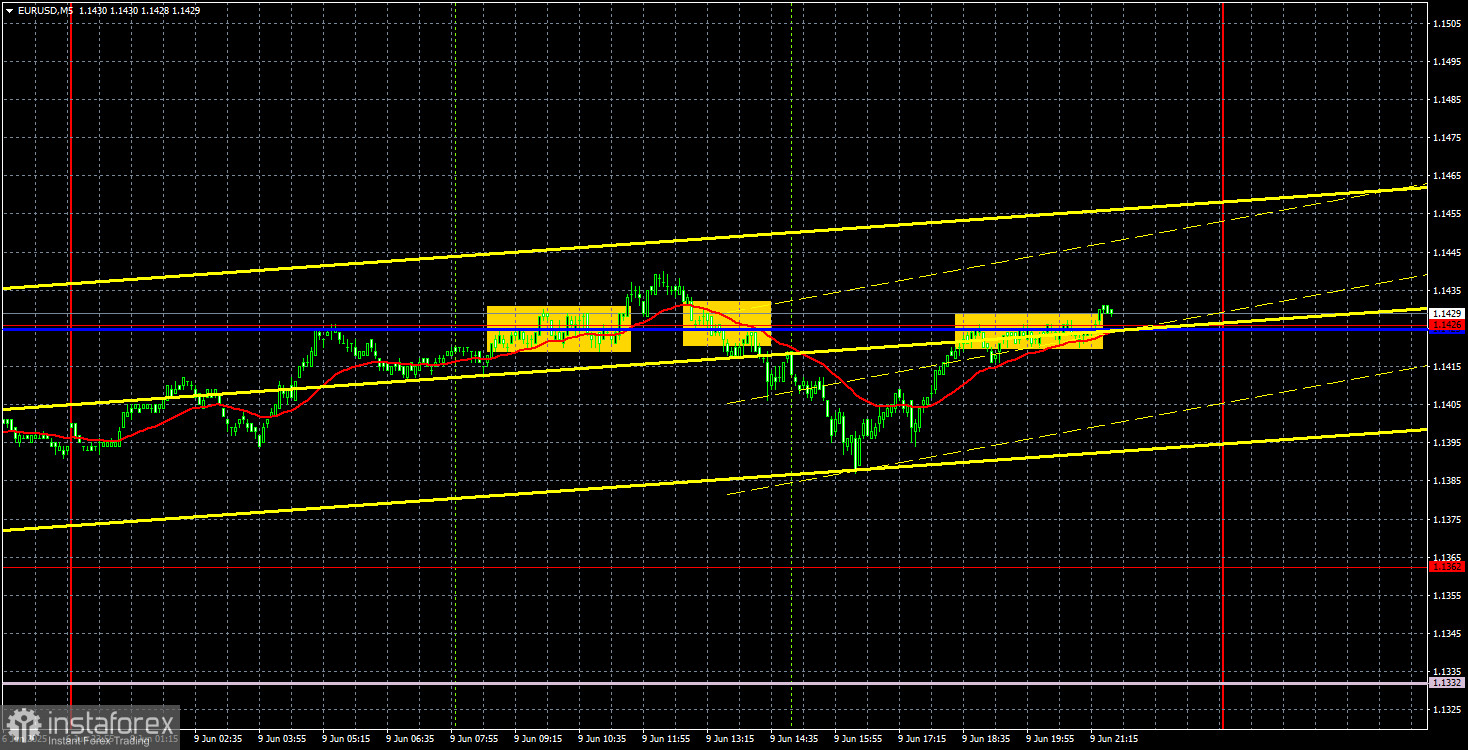
The EUR/USD currency pair traded mixed throughout Monday. Despite breaking through the trendline, the downward movement (i.e., strengthening the US dollar) never actually began. Thus, technical signals still hold little significance for traders, like all other factors unrelated to Donald Trump. We want to say that the market continues to focus on the trade war and, based on that, keeps ignoring the US currency. But that's no longer entirely the case. The White House continues to pump out a stream of news, each of which practically screams to traders – sell the dollar. Only recent developments in the US have managed to halt the emerging downtrend.
What are these developments? Let's recall: first, Trump decided to raise tariffs against the European Union (but then changed his mind); then, Democrats filed a lawsuit against Trump to revoke the trade tariffs (unsuccessfully). Shortly after, Trump launched a new wave of aggression and accusations against China. Later still, mass protests erupted in the US against Trump's immigration policy. And what positive developments occurred during that time? A NonFarm Payrolls report that didn't crash? Business activity indexes that weren't the worst ever? Not a single signed trade deal? As we can see, the market still has no reason to buy the dollar. The Federal Reserve's monetary policy still has no relevance.
On the 5-minute TF Monday, two trading signals were formed. First, the pair broke through the 1.1425–1.1426 area, but that buy signal was false. Then, the pair consolidated below the specified area, but the decline did not last long. Overall, daily volatility was about 50 pips. With such volatility, it was extremely difficult to count on solid profits.
COT Report
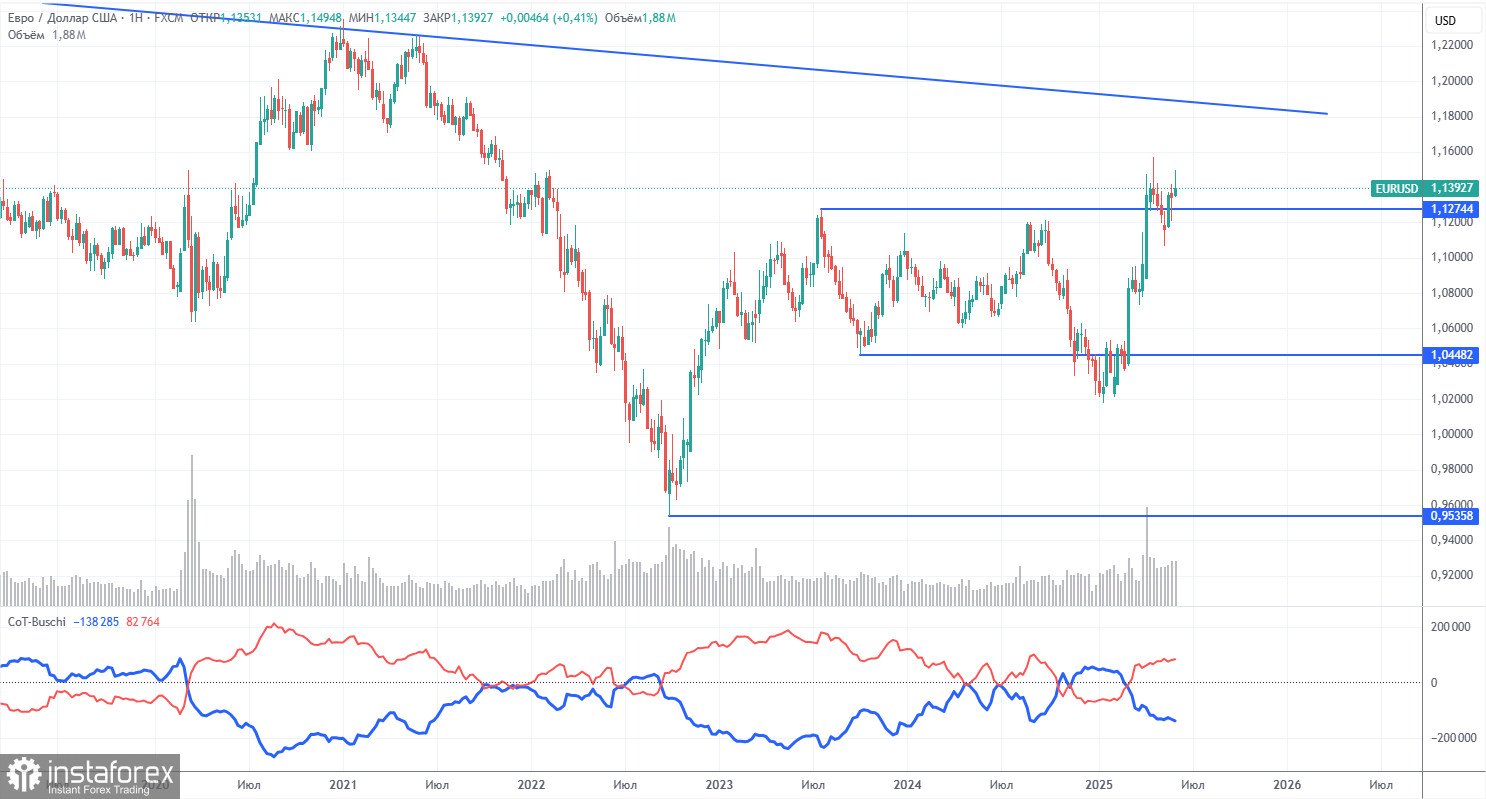
The latest COT report is dated June 3. The chart above shows that the net position of non-commercial traders had long been "bullish," and the bears barely managed to gain the upper hand at the end of 2024 but quickly lost it. Since Trump took office, only the dollar has been falling. We cannot confidently say that the dollar's decline will persist, but current global developments indicate this possibility.
We still see no fundamental factors for strengthening the euro, but one very significant factor is the decline of the dollar. The global downward trend persists, but what does the trend even matter now? Once Trump ends his trade wars, the dollar might start growing again — but will he end them, and when?
The red and blue lines have crossed again, meaning the market returns to a "bullish" trend. Over the last reporting week, the number of longs among the "Non-commercial" group decreased by 1,500, while shorts dropped by 4,800. As a result, the net position increased by 3,300.
EUR/USD 1-Hour Analysis
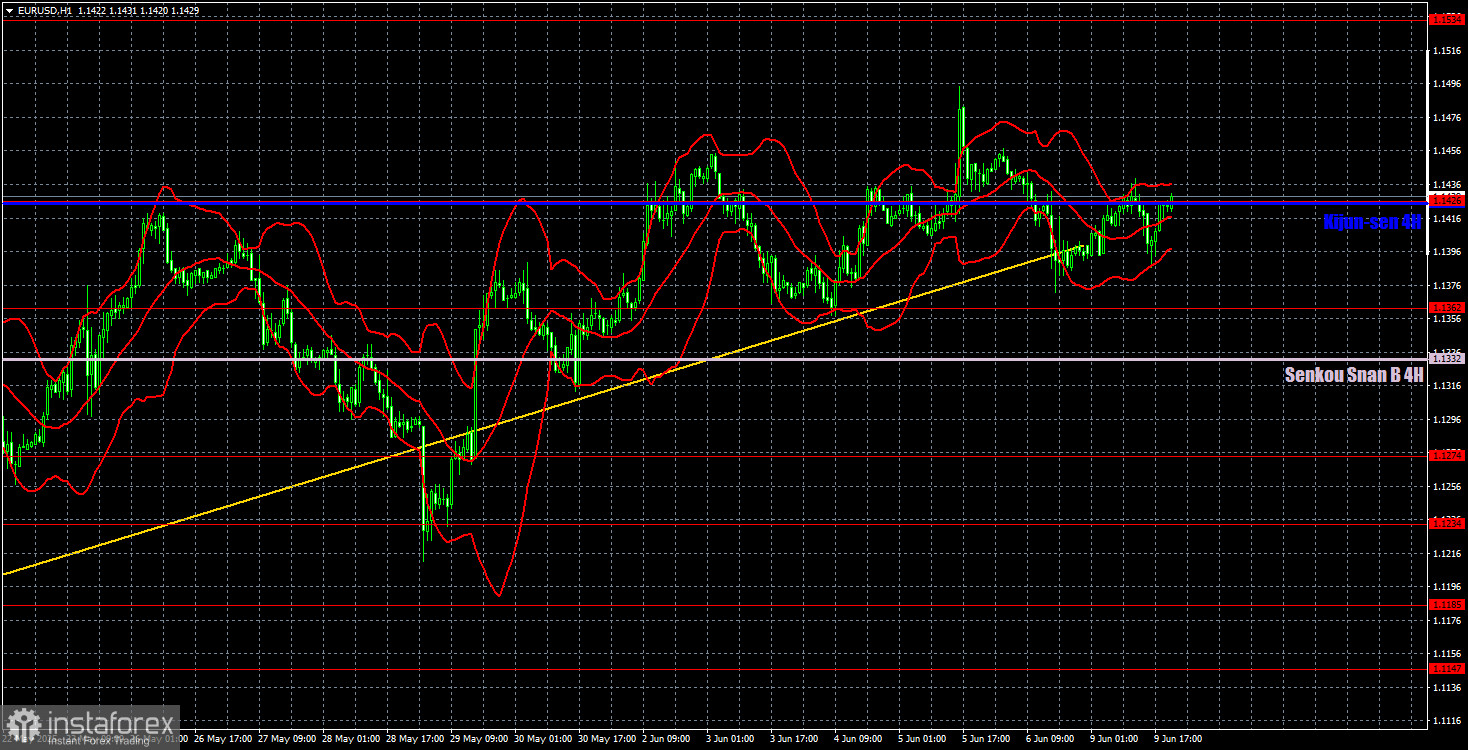
In the hourly timeframe, the EUR/USD pair maintains a local upward trend despite two breaches of the ascending trendline. As before (over the past 4 months), the market only reacts to events involving Trump, his decisions, and the trade war. Since there's little positive news on those topics, the dollar continues to decline regardless. Let us remind you that the Fed's monetary policy and the European Central Bank's stance suggest strong potential for dollar growth. However, as mentioned earlier, this factor (like many others) currently holds no significance for the market.
For June 10, we highlight the following levels for trading — 1.0949, 1.1006, 1.1092, 1.1147, 1.1185, 1.1234, 1.1274, 1.1362, 1.1426, 1.1534, 1.1607, as well as the Senkou Span B line (1.1332) and Kijun-sen (1.1425). Ichimoku indicator lines may shift throughout the day and should be considered when identifying trading signals. Don't forget to set a Stop Loss order at breakeven if the price moves 15 pips in the right direction. This protects against possible losses if the signal turns out to be false.
For Tuesday, no crucial events or reports are scheduled in either the Eurozone or the US, so any market reaction during the day will only be in response to news related to Trump. It's not guaranteed that such news will appear, but it's still best to monitor news feeds to avoid missing another "surge" in the currency market.
Illustration Explanations:
- Support and resistance price levels – thick red lines where movement may end. They are not trading signal sources.
- Kijun-sen and Senkou Span B lines—These are strong Ichimoku indicator lines transferred to the hourly timeframe from the 4-hour one.
- Extremum levels – thin red lines where the price has previously rebounded. These act as trading signal sources.
- Yellow lines – trend lines, trend channels, and other technical patterns.
- COT Indicator 1 on the charts – the size of the net position for each category of traders.