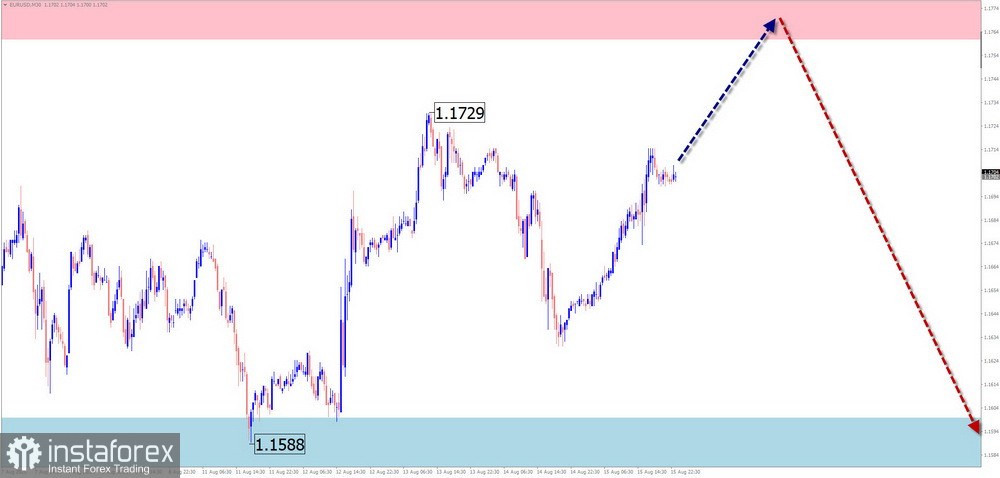
EUR/USD
Analysis: The incomplete upward wave of the main euro pair has been in progress since February this year. Within the latest segment, a counter-trend corrective wave of a complex form has been developing since mid-July. The current structure is setting conditions for the correction to end and a new trend segment to begin.
Forecast: At the beginning of the week, an upward move in the euro is the most likely scenario, followed by sideways trading near resistance levels. Short-term pressure on the upper boundary of the zone is possible. Increased volatility and a reversal may occur closer to the weekend, potentially synchronized with the release of major economic news.
Potential Reversal Zones
- Resistance: 1.1760/1.1810
- Support: 1.1600/1.1550
Recommendations:
- Selling: may be used once sell signals appear near resistance. The downward potential remains limited.
- Buying: carries increased risk in the coming days with low profit potential.
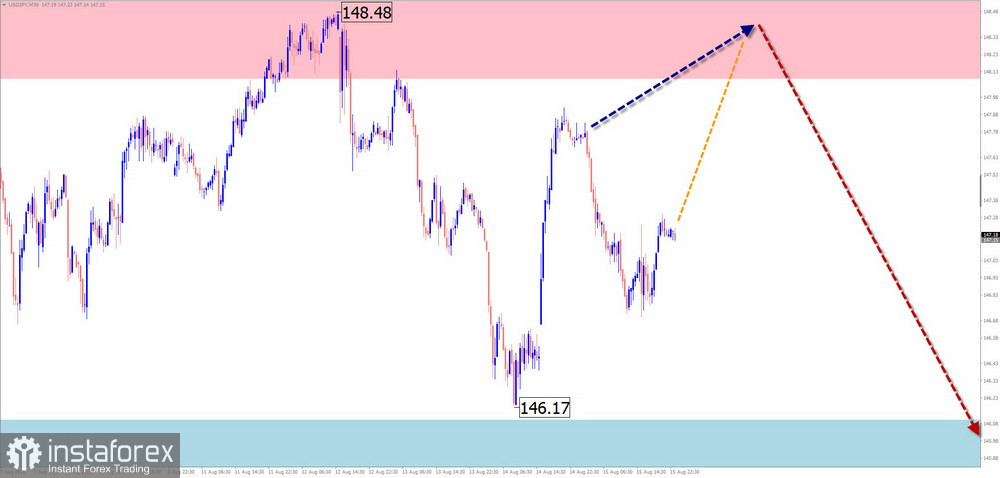
USD/JPY
Analysis: The yen's major pair shows a change in trend. The incomplete bearish segment began on August 1. Its wave level does not exceed the size of the correction to the previous bullish trend. The price has broken through the lower boundary of interim support, which has now turned into resistance. For a further decline, the pair needs to consolidate at this level.
Forecast: Sideways trading along the resistance zone is expected early in the week, followed by a reversal and the start of active price decline. A short-lived rise in volatility with a brief test of the upper boundary is possible.
Potential Reversal Zones
- Resistance: 148.10/148.60
- Support: 146.10/145.60
Recommendations:
- Buying: possible in fractional volumes during individual sessions.
- Selling: safer to wait for signals near resistance before entering trades.
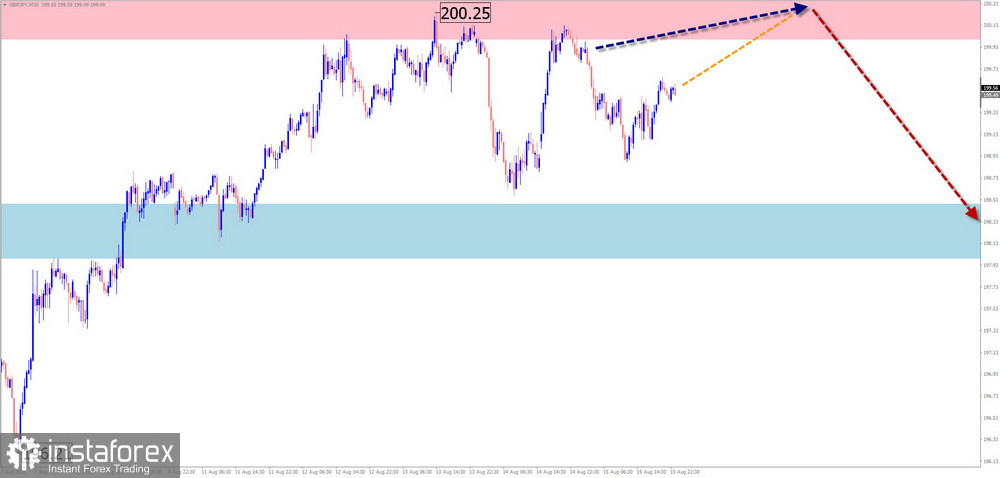
GBP/JPY
Analysis: Since April, the pound/yen pair has been in a short-term upward trend. The price reached the lower boundary of a major potential reversal zone. From that boundary, the pair formed a counter-trend correction over the past month. The upward move from August 4 carries reversal potential.
Forecast: An upward move is expected early in the week. After reaching resistance, reversal conditions may form, followed by renewed downside momentum. This timing may coincide with important economic releases.
Potential Reversal Zones
- Resistance: 200.20/200.70
- Support: 198.50/198.00
Recommendations:
- Selling: limited potential, carries high risk.
- Buying: premature before the upcoming decline is complete; wait for signals near support.
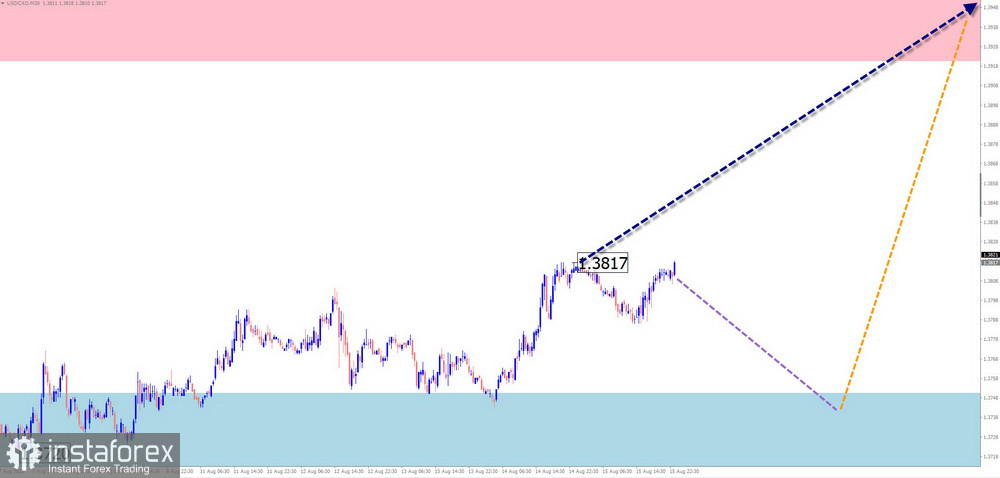
USD/CAD
Analysis: Since September last year, the Canadian dollar's main pair has been trading within a wide sideways channel. Within the short-term trend, the incomplete segment from June 16 is upward. Prices have reached an interim resistance zone. The downward leg from August 8 carries reversal potential.
Forecast: Over the next few days, the pair is likely to pull back lower and move sideways near support. The second half of the week is expected to bring higher volatility. After possible pressure on the support boundary, a reversal and upward move toward resistance may follow.
Potential Reversal Zones
- Resistance: 1.3920/1.3970
- Support: 1.3750/1.3700
Recommendations:
- Buying: relevant once signals appear near support in your trading system.
- Selling: limited potential; use smaller volume sizes.
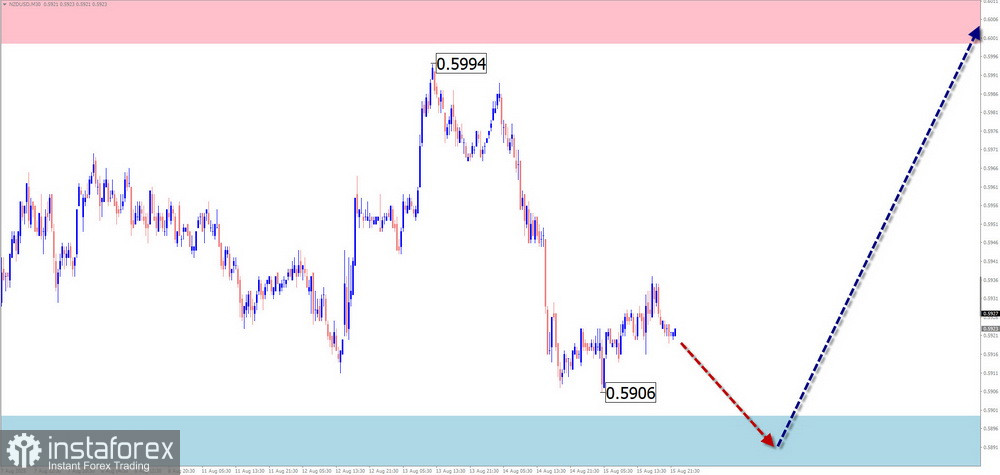
NZD/USD
Analysis: Since April, the New Zealand dollar has been forming an upward wave, which on a larger scale initiated a new trend segment. The middle part (B) is developing in the form of a flat correction. The price remains confined within a narrow corridor.
Forecast:
The coming week is expected to complete the decline, form a reversal, and resume upward movement. The rise may extend up to the resistance zone. Early in the week, temporary pressure on the lower boundary of support cannot be ruled out.
Potential Reversal Zones
- Resistance: 0.6000/0.6050
- Support: 0.5900/0.5850
Recommendations:
- Selling: highly risky and potentially unprofitable.
- Buying: possible after confirmed reversal signals appear on your trading systems.
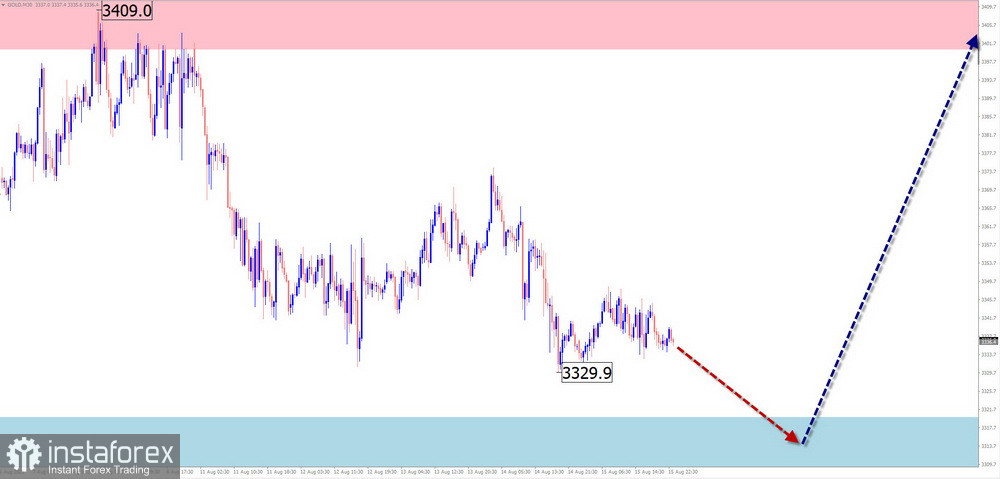
Gold
Analysis: On the weekly chart, gold has been forming a sideways downward correction since April. The final part (C) remains incomplete. In recent months, the price has consolidated within a horizontal corridor, pulling back downward over the past week.
Forecast: A sideways move is expected to continue next week. A downward vector is more likely early in the week, with completion expected near support. The price is then likely to shift into sideways trading, creating conditions for renewed growth. A trend reversal could occur at the end of the week or later.
Potential Reversal Zones
- Resistance: 3400.0/3450.0
- Support: 3320.0/3270.0
Recommendations:
- Selling: limited by support; safer to use smaller positions.
- Buying: possible in fractional volumes after confirmed reversal signals appear near support.
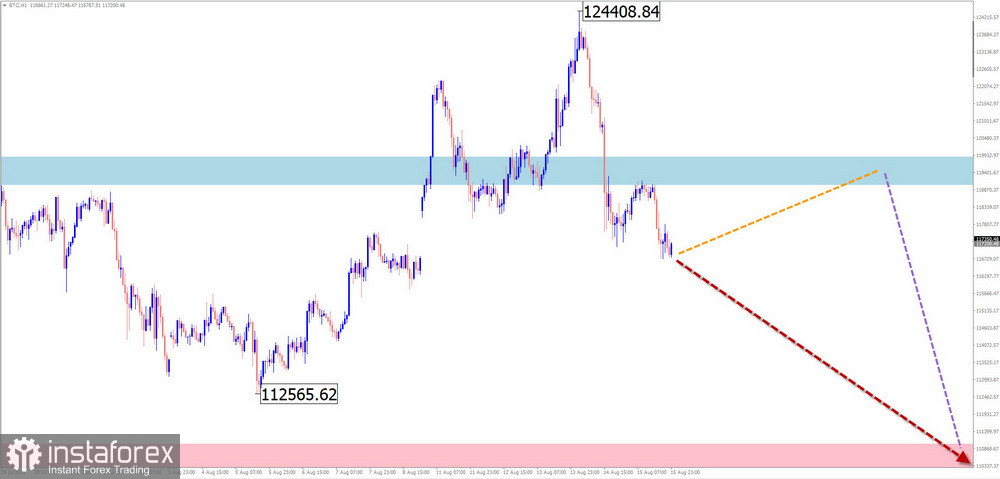
#Bitcoin
Analysis: The upward trend has brought Bitcoin to a strong potential reversal zone on the higher timeframe. From its lower boundary, the price retraced downward last month, forming a corrective decline with reversal potential. The upper boundary of the expected weekly range now serves as interim resistance.
Forecast: Next week, sideways movement is expected to continue. In the first days, an upward vector toward resistance is more likely. After reaching this zone, the price may consolidate sideways, creating conditions for renewed decline.
Potential Reversal Zones
- Resistance: 119000.0/120000.0
- Support: 111000.0/110000.0
Recommendations:
- Buying: only possible during individual sessions with small volume sizes.
- Selling: not relevant until confirmed reversal signals appear near resistance.
Notes: In simplified wave analysis (SWA), all waves consist of three parts (A-B-C). On each timeframe, the analysis is applied to the latest incomplete wave. Dashed lines indicate expected movements.
Attention: The wave algorithm does not account for the duration of price moves over time.