Trade Analysis for Monday:
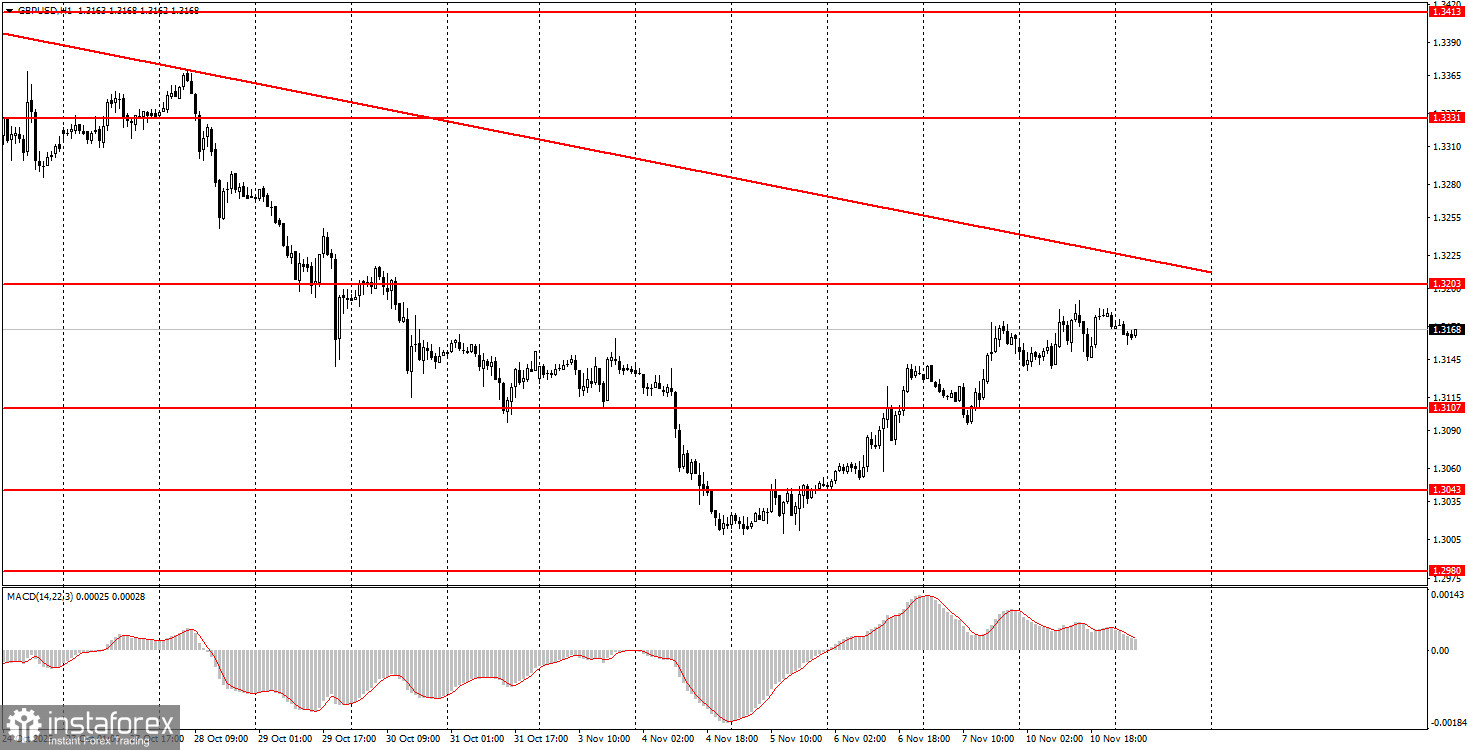
1H Chart of the GBP/USD Pair
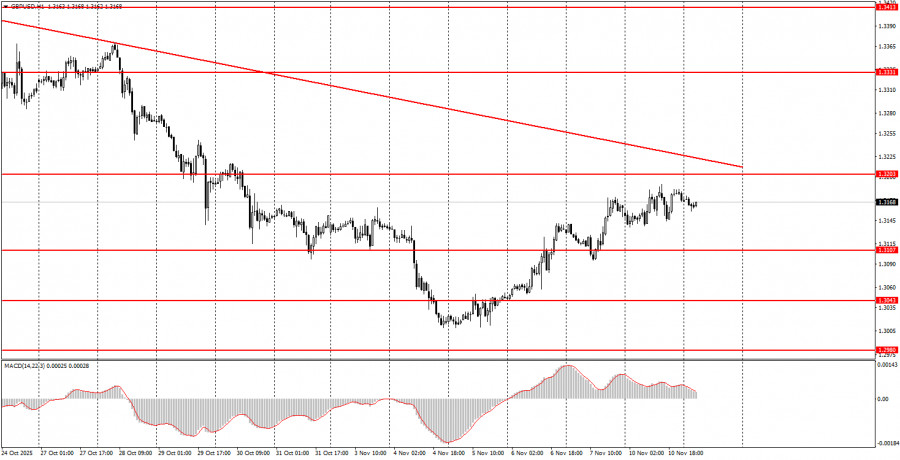
The GBP/USD pair attempted to continue its upward movement from recent days on Monday, but overall, it moved sideways more than up. This is not surprising, as no significant news became available to traders on Monday. Of course, the news about the possible end of the "shutdown" can be considered "important," but let's remember that the "shutdown" is not yet over, and what is being discussed is a temporary truce between the Democrats and Republicans and temporary funding for the U.S. government and its services. As early as next year, America could very well face a new "shutdown" if the Democrats and Republicans do not come to an agreement on Medicaid in December. Even if the "shutdown" concludes this week, we do not expect the dollar to strengthen, as it has risen over the past month and a half, often without serious grounds for doing so. Therefore, on the hourly timeframe, we are waiting for a breach of the trend line, a change in trend to the upside, and a continuation of the movement to the north.
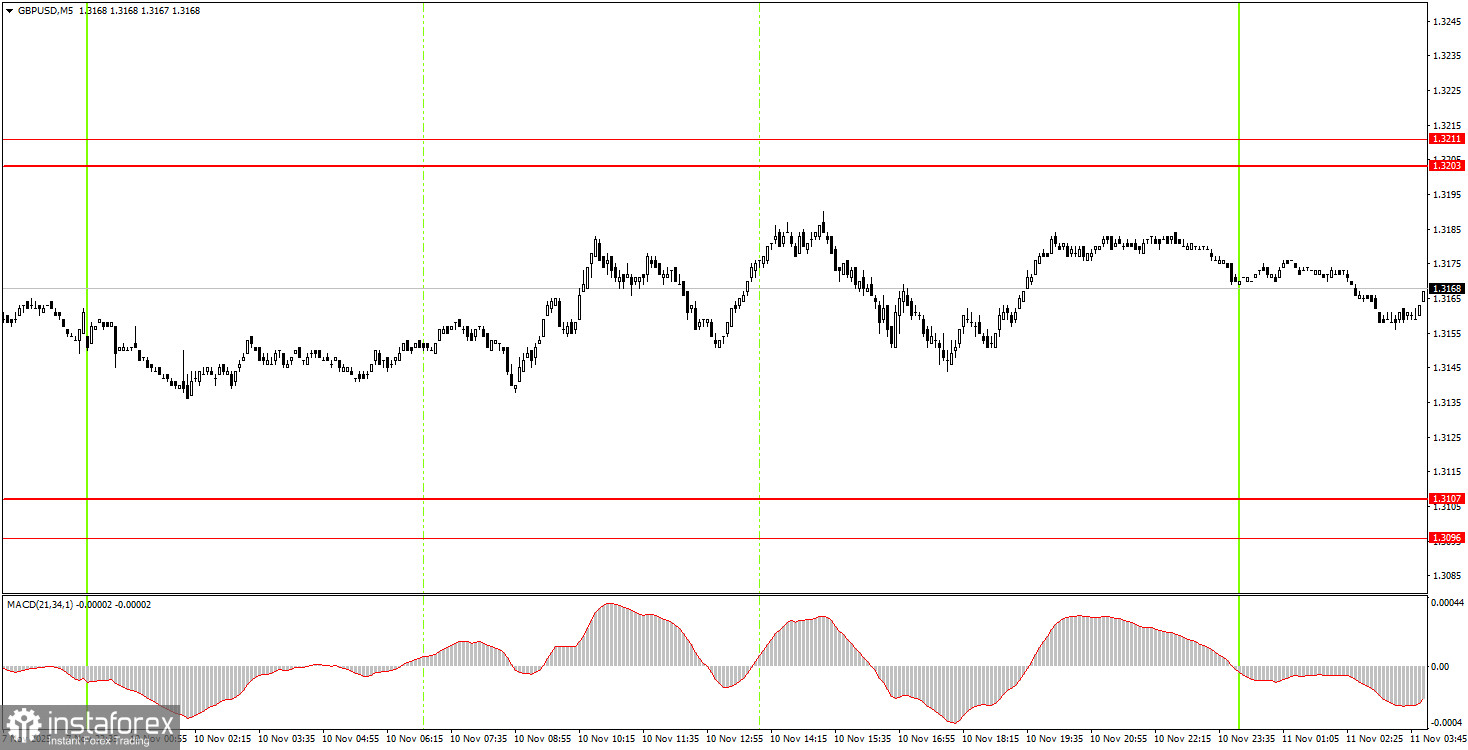
5M Chart of the GBP/USD Pair
On the 5-minute timeframe, no trading signals were formed on Monday. The price did not approach important levels and areas throughout the day. Thus, there were no grounds for opening trades for novice traders unless they had maintained long positions from Friday.
How to Trade on Tuesday:
On the hourly timeframe, the GBP/USD pair continues to form a new descending trend, and the British pound has been declining for absolutely any reason over the past month and a half. As we have already mentioned, there are no global reasons for prolonged dollar growth, so we expect movement only to the upside in the medium term. However, the flat (or correction) factor in the long term continues to pull the pair down, which is an entirely illogical development from a macroeconomic and fundamental perspective.
On Tuesday, novice traders will need to look for new trading signals in the ranges of 1.3203-1.3211 and 1.3096-1.3107. If long positions from Friday are still open, they can be closed for a decent profit.
On the 5-minute timeframe, you can trade at the levels of 1.2913, 1.2980-1.2993, 1.3043, 1.3096-1.3107, 1.3203-1.3211, 1.3259, 1.3329-1.3331, 1.3413-1.3421, 1.3466-1.3475, 1.3529-1.3543, and 1.3574-1.3590. No important events are scheduled in the UK and the U.S. for Tuesday, so movements during the day may be sluggish. A new rise in the British currency will somewhat confirm that the period of illogical dollar growth is nearing its end.
Key Principles of My Trading System:
- The strength of the signal is considered based on the time taken to form the signal (bounce or breach of a level). The less time taken, the stronger the signal.
- If two or more trades have been opened around a certain level based on false signals, all subsequent signals from that level should be ignored.
- In a flat market, any pair can create numerous false signals or may not form them at all. In any case, it's best to stop trading at the first signs of a flat.
- Trading deals are opened during the period between the start of the European session and the middle of the American session, after which all deals should be closed manually.
- On the hourly timeframe, it is preferable to trade based on signals from the MACD indicator only when there is good volatility and a trend that is confirmed by a trend line or trend channel.
- If two levels are too close to each other (between 5 and 20 pips), they should be treated as an area of support or resistance.
- After a 20-pip move in the right direction, a Stop Loss should be set to breakeven.
What the Charts Show:
- Support and resistance price levels are targets for opening buy or sell positions. Take Profit levels can be placed around them.
- Red lines indicate trend channels or trend lines, reflecting the current trend and indicating the preferred trading direction.
- The MACD indicator (14,22,3) — histogram and signal line — is a supplementary indicator that can also be used as a source of signals.
Important announcements and reports (always available in the news calendar) can significantly impact the movement of the currency pair. Therefore, during their release, it is recommended to trade with maximum caution or to exit the market to avoid sharp reversals against the preceding movement.
Beginners trading on the Forex market should remember that not every trade can be profitable. Developing a clear strategy and money management is key to long-term success in trading.