The GBP/USD currency pair declined significantly on Friday. This drop in the British pound is somewhat puzzling, as there were no strong fundamental reasons behind it. We do not believe that the UK services PMI and retail sales could have triggered a two-day plunge in the pound. Therefore, the only reasonable conclusion is that the price continues to correct — and it's more appropriate to view this correction not on the 4-hour chart, but on the daily one.
Indeed, UK macroeconomic data last week turned out weaker than forecasts, but it can't be called disastrous. It's also worth noting that the pound was actively rising in the first half of the week — which is important, as there were virtually no macroeconomic reports in the UK or the U.S. on Monday, Tuesday, or Wednesday. This again suggests that the recent movements are largely of a technical nature.
From this standpoint, one might assume — following the decline on Thursday and Friday — that a new phase of global correction has begun. However, as we've already mentioned, the new week will bring many important events and reports, so traders' short-term sentiment may shift more than once.
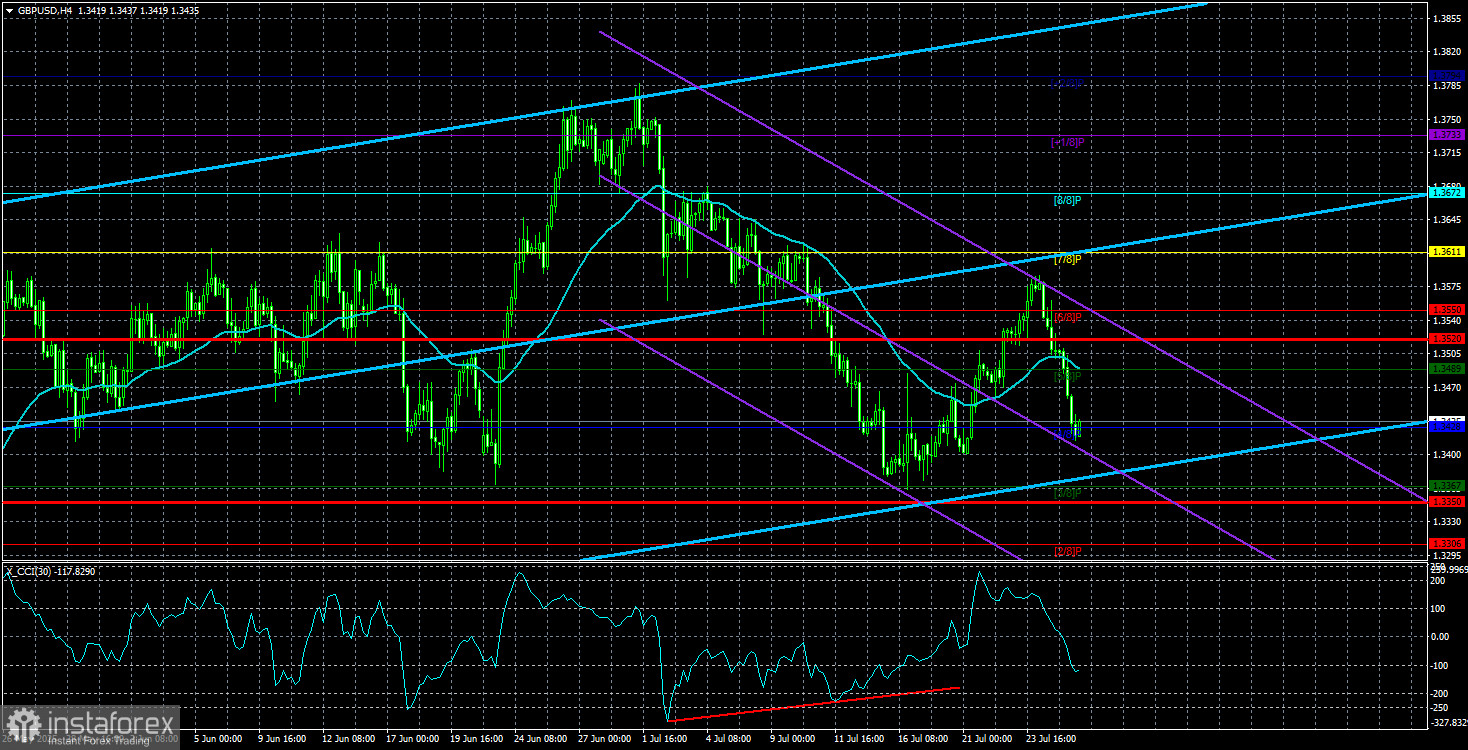
Technically, this appears to be a resumption of the downward correction on the daily timeframe, which may take the shape of a classic three-wave pattern. On the 4-hour chart, the price has consolidated below the moving average. The Federal Reserve meeting is unlikely to have a significant impact on the GBP/USD pair. A trade deal between the U.S. and the EU is more relevant to the EUR/USD pair, and Donald Trump seems to have accepted that Jerome Powell will remain Fed Chair until the end of his term. Therefore, only U.S. macroeconomic data poses a potential risk for the dollar. If the data disappoints, the market may seize the opportunity to sell more dollars.
Let's also remember that the UK-U.S. trade deal was signed long ago, and the recent agreement with Japan did not spark any market enthusiasm about a de-escalation of trade tensions. Thus, we won't treat any future trade agreements as a reason to buy the U.S. dollar.
What will happen on or after August 1 remains an open question. If Trump proceeds with raising tariffs on 24 countries, as promised, and imposes duties on copper and pharmaceutical imports, this would amount to a clear escalation of the trade war. A few trade deals won't be enough to reverse that. We continue to believe that without a major policy shift from Trump, the U.S. dollar has little to look forward to. Perhaps once Trump slaps tariffs on the entire world and replaces the Fed Chair, he'll calm down — and so will the market, which has been consistently selling the dollar.
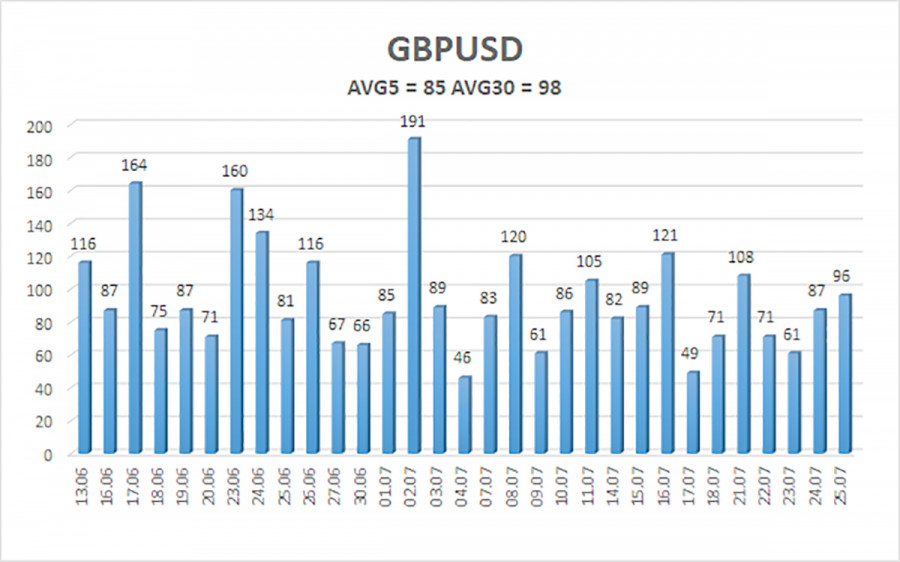
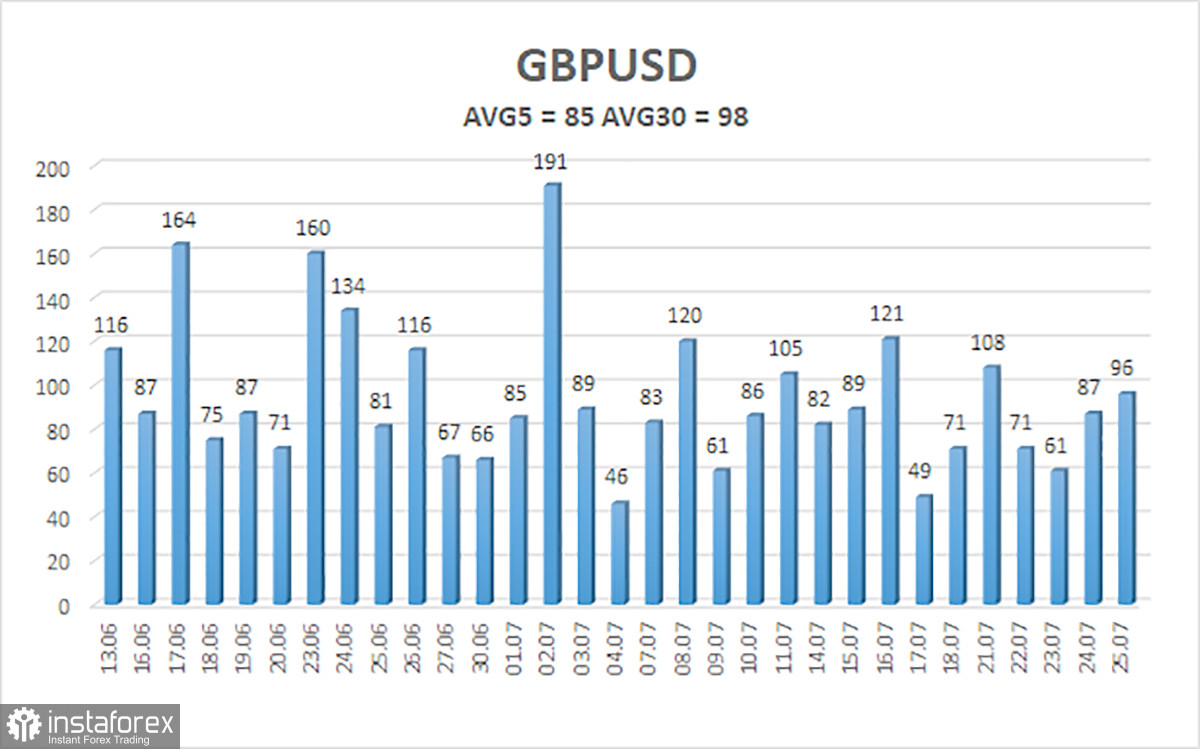
The average volatility for GBP/USD over the past five trading days is 85 pips, which is considered "moderate" for this pair. Therefore, on Monday, July 28, we expect movement within a range defined by the levels 1.3350 to 1.3520. The long-term linear regression channel is pointing upward, signaling a clear uptrend. The CCI indicator has entered oversold territory twice, signaling the resumption of a bullish trend. Two bullish divergences have already formed, and a third one is currently developing.
Nearest Support Levels:
S1 – 1.3428
S2 – 1.3367
S3 – 1.3306
Nearest Resistance Levels:
R1 – 1.3489
R2 – 1.3550
R3 – 1.3611
Trading Recommendations:
The GBP/USD currency pair has resumed its downward technical correction. In the medium term, Trump's policies are likely to continue putting pressure on the dollar. Therefore, long positions targeting 1.3611 and 1.3672 remain relevant if the price stays above the moving average. If the price is below the moving average, short positions with a target of 1.3367 can be considered on purely technical grounds. From time to time, the U.S. dollar exhibits corrective strength, but for a sustainable bullish trend to emerge, evident signs of an end to the global trade war are needed—something that now seems increasingly unlikely.
Explanation of Illustrations:
Linear Regression Channels help determine the current trend. If both channels are aligned, it indicates a strong trend.
Moving Average Line (settings: 20,0, smoothed) defines the short-term trend and guides the trading direction.
Murray Levels act as target levels for movements and corrections.
Volatility Levels (red lines) represent the likely price range for the pair over the next 24 hours based on current volatility readings.
CCI Indicator: If it enters the oversold region (below -250) or overbought region (above +250), it signals an impending trend reversal in the opposite direction.