Analysis of Wednesday's Trades
1H Chart of GBP/USD
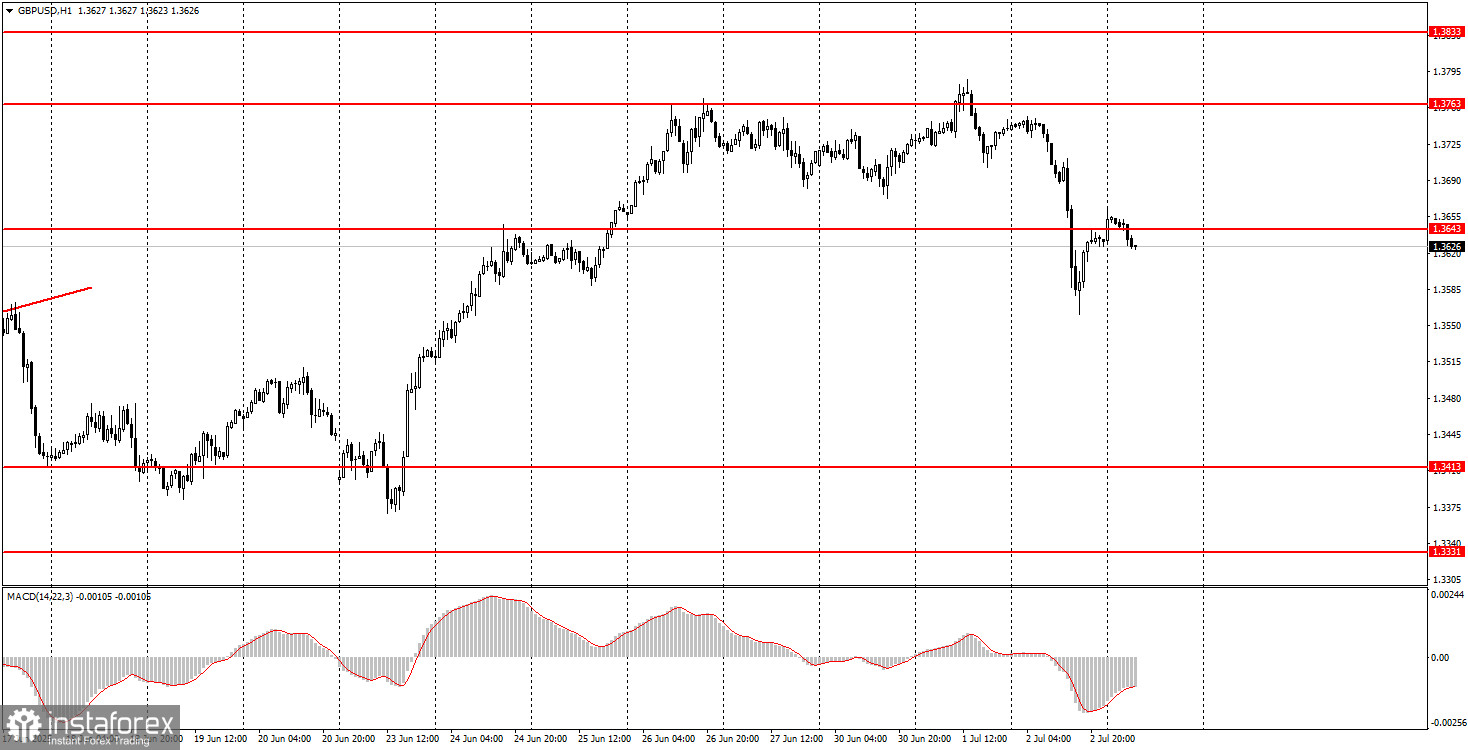
On Wednesday, the GBP/USD pair plunged like a stone dropped from a skyscraper, prompting currency analysts to immediately search for the reasons behind such a fall. However, we take a different view of such market moves: there isn't always a clear reason. The British pound had been rising for a long time, had become overbought, and there are enough market makers in the market who regularly hunt for retail trader liquidity. Therefore, it is quite possible that what we saw was a crash that may precede a new rally of the British currency.
We see no reason for such a sharp drop in the pound "out of the blue." Today, everything depends on the NonFarm Payrolls and unemployment rate reports from the U.S. If the data turns out strong, the dollar could post a second consecutive day of gains. If the data is weak, the dollar's rally may end just as quickly. The overall fundamental backdrop for the dollar hasn't changed enough to expect explosive growth.
5M Chart of GBP/USD
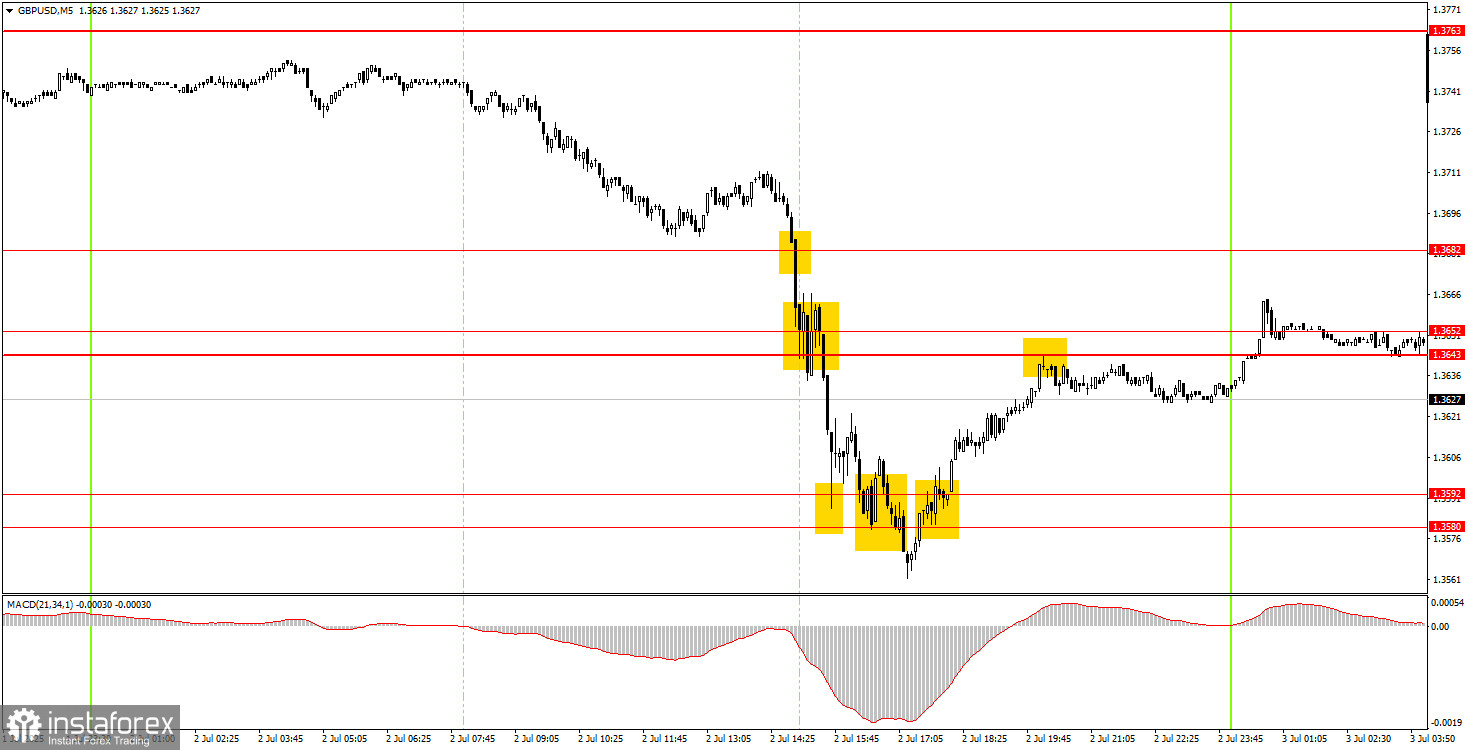
In the 5-minute timeframe, a large number of trading signals were formed throughout Wednesday, most of which were very difficult to act on. As we've already noted, there was no real reason for such a sharp fall. Which means it was impossible to predict the pound's collapse. Therefore, one could only respond to technical signals.
The decline began much earlier than the first sell signal formed, and the price moved very erratically. We believe that the only setups that could be reasonably traded were the breakthrough of the 1.3643–1.3652 range, as well as the consolidation above the 1.3580–1.3592 area.
Trading Strategy for Thursday:
On the hourly timeframe, the GBP/USD pair experienced a sharp drop, but we do not believe this marks the beginning of a "dollar trend." The market still either sells the dollar or waits for new negative developments from across the ocean to sell it again. This will continue until the market sees real signs of an end to the trade war, and Trump stops making decisions for which he has no authority, leaving market participants in a state of shock.
On Thursday, the GBP/USD pair may move in any direction, as everything will depend on important macroeconomic reports from the U.S.
On the 5-minute TF, you can now trade at the levels of 1.3203-1.3211, 1.3259, 1.3329-1.3331, 1.3413-1.3421, 1.3518-1.3535, 1.3580-1.3592, 1.3643-1.3652, 1.3682, 1.3763, 1.3814-1.3832. On Thursday, only one report is scheduled in the UK – the final Services PMI for June. In the U.S., however, three major reports will be released: the ISM Services Index, NonFarm Payrolls, and the unemployment rate. These three reports will determine the pair's movement during the U.S. trading session.
Core Trading System Rules:
- Signal Strength: The shorter the time it takes for a signal to form (a rebound or breakout), the stronger the signal.
- False Signals: If two or more trades near a level result in false signals, subsequent signals from that level should be ignored.
- Flat Markets: In flat conditions, pairs may generate many false signals or none at all. It's better to stop trading at the first signs of a flat market.
- Trading Hours: Open trades between the start of the European session and the middle of the US session, then manually close all trades.
- MACD Signals: On the hourly timeframe, trade MACD signals only during periods of good volatility and a clear trend confirmed by trendlines or trend channels.
- Close Levels: If two levels are too close (5–20 pips apart), treat them as a support or resistance zone.
- Stop Loss: Set a Stop Loss to breakeven after the price moves 20 pips in the desired direction.
Key Chart Elements:
Support and Resistance Levels: These are target levels for opening or closing positions and can also serve as points for placing Take Profit orders.
Red Lines: Channels or trendlines indicating the current trend and the preferred direction for trading.
MACD Indicator (14,22,3): A histogram and signal line used as a supplementary source of trading signals.
Important Events and Reports: Found in the economic calendar, these can heavily influence price movements. Exercise caution or exit the market during their release to avoid sharp reversals.
Forex trading beginners should remember that not every trade will be profitable. Developing a clear strategy and practicing proper money management are essential for long-term trading success.