The EUR/USD currency pair continued trading higher on Friday, but who can be surprised by yet another drop in the dollar at this point? The U.S. currency has been falling for exactly two weeks now. Two Mondays ago, the Geneva talks unexpectedly yielded positive results: tariffs between China and the U.S. were reduced by a significant 115%, marking a crucial step towards a truce. However, as previously stated, this was not a step toward peace. It was a move to avoid halting trade between the two countries, which would benefit no one. So Beijing and Washington stopped playing the "who can escalate more" game and kept only those tariffs that both sides could bear.
Yet the dollar's burst of optimism was short-lived. In reality, any tariffs above 30–50% signal that the trade war is only gaining momentum. If the situation were as follows — Trump imposed 10% tariffs (a manageable level for most countries) and then gradually reduced them after reaching agreements — we could discuss de-escalation. Instead, Trump imposed tariffs over 100% against China, which makes no sense at all, then reduced them to 30%, all while threatening the entire world over the "Huawei issue." In other words, Trump lowers tariffs only to "high levels" while simultaneously threatening to raise EU tariffs to 50% and penalize all countries using Huawei chips — chips that are "almost certainly American." So, where is the de-escalation?
Simultaneously, Donald Trump threatened Apple with 25% tariffs on products assembled outside the U.S. He also wants to raise tariffs on EU goods starting June 1. In practice, there's no sign of de-escalation. And the dollar — which now needs very little to fall — continues declining at every opportunity. Every new statement about possible or actual tariffs from the U.S. is just another nail in its coffin.
A couple of weeks ago, we suggested that the dollar might stage a strong rebound if trade war de-escalation continued. But clearly, there is no de-escalation, and Trump continues to act like a spoiled child who has been denied candy. If this weren't about the world's largest economy, market participants might laugh at the situation and go about their business. But even four months into the presidency of America's "Chief and Savior of the Nation," the outlook is far from encouraging. More and more investors are pulling away from U.S. assets, bonds, and economic investments. More and more consumers are rejecting U.S. goods. The irony is that Trump wants to use tariffs on the EU to force European companies to relocate production to America. Let's not forget that even U.S. companies are not eager to return to the United States.
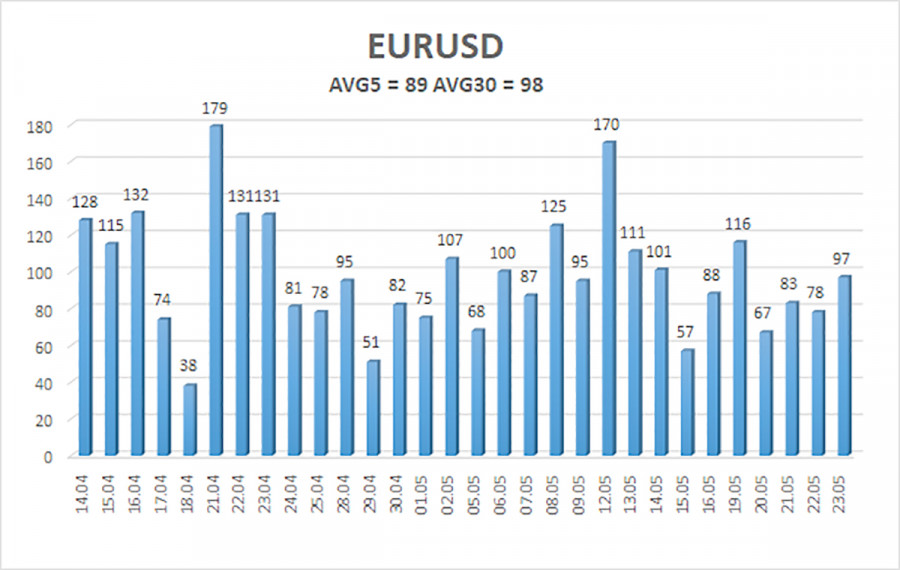
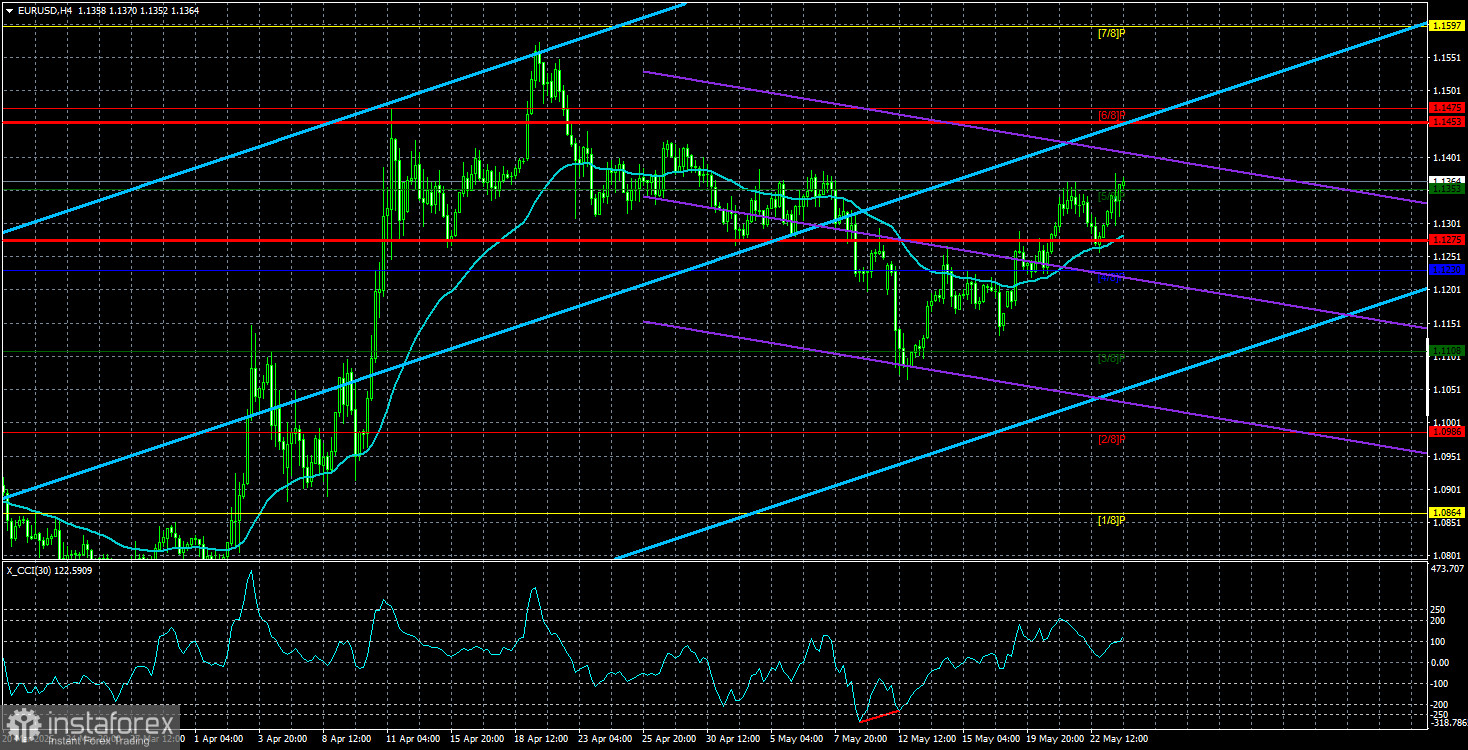
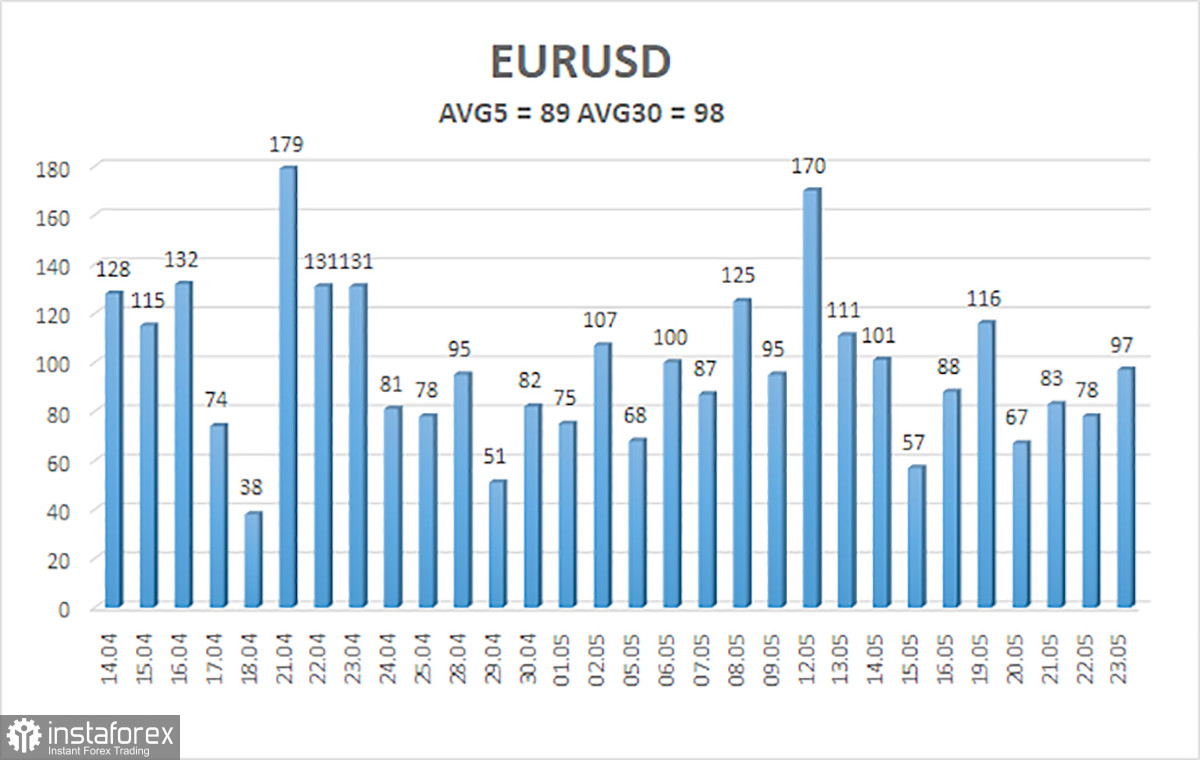
As of May 26, the average volatility of the EUR/USD pair over the last five trading days stands at 89 pips, which qualifies as "average." On Monday, we expect the pair to move between 1.1275 and 1.1453. The long-term regression channel is pointing upward, continuing to signal a bullish trend. The CCI indicator recently entered the oversold zone, and a bullish divergence has formed, pointing to a trend continuation, which we are now witnessing.
Nearest Support Levels:
S1 – 1.1353
S2 – 1.1230
S3 – 1.1108
Nearest Resistance Levels:
R1 – 1.1475
R2 – 1.1597
R3 – 1.1719
Trading Recommendations:
The EUR/USD pair is attempting to resume its uptrend. For months, we've been saying that we expect a medium-term decline in the euro, as the dollar fundamentally has no reason to weaken — other than Trump's policies, which will likely have destructive consequences for the U.S. economy. Nevertheless, we continue to observe the market's complete unwillingness to buy the dollar, even when there are solid reasons to do so. Short positions remain relevant if the price is below the moving average, with targets at 1.1230 and 1.1108. If the price is above the moving average line, long positions should be considered with targets at 1.1453 and 1.1475.d
Explanation of Illustrations:
Linear Regression Channels help determine the current trend. If both channels are aligned, it indicates a strong trend.
Moving Average Line (settings: 20,0, smoothed) defines the short-term trend and guides the trading direction.
Murray Levels act as target levels for movements and corrections.
Volatility Levels (red lines) represent the likely price range for the pair over the next 24 hours based on current volatility readings.
CCI Indicator: If it enters the oversold region (below -250) or overbought region (above +250), it signals an impending trend reversal in the opposite direction.