پیر کی تجارت کا تجزیہ
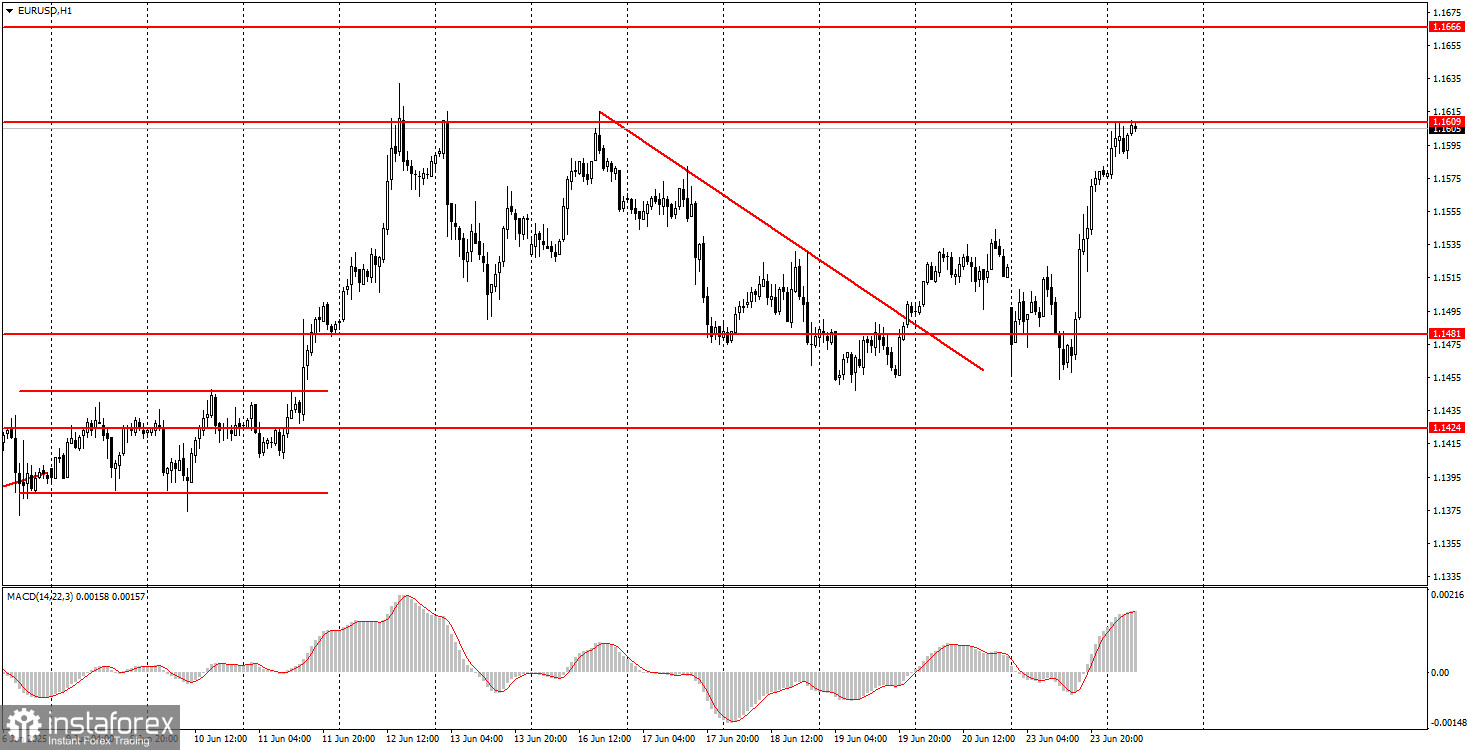
یورو/امریکی ڈالر کا 1گھنٹے کا چارٹ
پیر کو، یورو/امریکی ڈالر کرنسی کے جوڑے نے کافی مضبوط حرکت کا مظاہرہ کیا۔ ابتدائی طور پر، مارکیٹ میں اتار چڑھاؤ خاص طور پر زیادہ نہیں تھا، حالانکہ خبروں کا بہاؤ رات کے اوائل میں ہی "پروازوں" کو متحرک کر سکتا تھا۔ تاہم، سب سے مضبوط حرکتیں سب سے زیادہ فعال تجارتی سیشن کے دوران ہوئیں - امریکی سیشن۔ جیسا کہ متوقع تھا، ڈالر مشرق وسطیٰ میں بڑھتی ہوئی صورتحال سے کوئی فائدہ حاصل کرنے میں ناکام رہا۔ ہم نے پہلے خبردار کیا تھا کہ امریکہ اب جنگ میں مکمل طور پر شریک ہے، اور کل تک، قطر، اسرائیل اور خلیج فارس کے دیگر ممالک جہاں امریکی فوجی اڈے موجود ہیں، پر ایرانی حملوں کے بارے میں رپورٹس سامنے آ چکی تھیں۔
اس طرح، ڈالر - جسے 2025 میں اب کوئی بھی "محفوظ پناہ گاہوں کی کرنسی" کے طور پر نہیں دیکھتا ہے - اب یقینی طور پر ایک نہیں سمجھا جا سکتا ہے۔ نتیجے کے طور پر، یورو/امریکی ڈالر کا جوڑا تیزی سے، آسانی سے، اور آسانی سے موجودہ سال کی بلندیوں پر واپس آگیا۔ تمام نشانیاں اوپر کی حرکت کے تسلسل کی طرف اشارہ کرتی ہیں۔
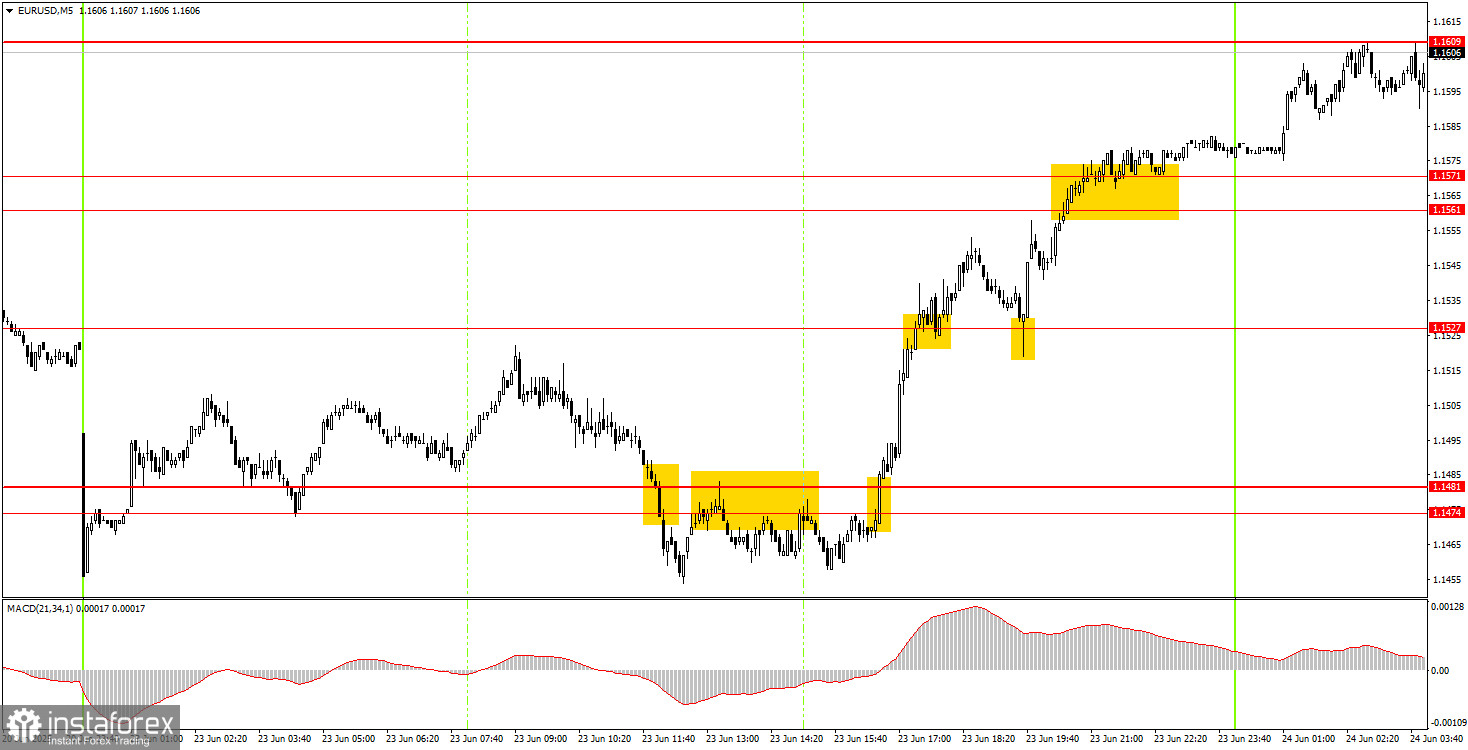
یورو/امریکی ڈالر کا 5 منٹ کا چارٹ
پیر کے روز، 5 منٹ کے ٹائم فریم پر بہت سے ٹھوس تجارتی سگنل بنائے گئے۔ دن کے پہلے نصف میں، قیمت میں زیادہ تر کمی واقع ہوئی، جس سے 1.1474–1.1481 علاقے کے ارد گرد کئی اوورلیپنگ سیل سگنلز پیدا ہوئے۔ ان اشاروں کی بنیاد پر ایک مختصر پوزیشن کھولی جا سکتی تھی، لیکن یہ ایک خسارے کی تجارت ثابت ہوئی۔
تاہم، ایک مضبوط اوپر کی ریلی کے بعد. قیمت نے اسی علاقے میں خرید کا سگنل پیدا کیا اور اس کے بعد سے مسلسل بڑھتا ہی جا رہا ہے، جس کے ساتھ ساتھ نئے خرید سگنل بھی بنتے ہیں۔ اس طرح، وہ لوگ جنہوں نے امریکی سیشن کے دوران لمبی پوزیشنیں کھولیں وہ کم از کم 80-90 پِپس حاصل کر سکتے تھے۔
منگل کے لیے تجارتی حکمت عملی:
یورو/امریکی ڈالر جوڑا گھنٹہ وار ٹائم فریم پر اپنے اوپر کی طرف رجحان کو جاری رکھے ہوئے ہے، جو ڈونلڈ ٹرمپ کے دور میں شروع ہوا اور صرف اگلے صدر کے تحت ختم ہو سکتا ہے۔ اصولی طور پر، یہ حقیقت کہ ٹرمپ کا ریاستہائے متحدہ کا صدر بنے رہنا اب بھی امریکی ڈالر کو گراوٹ میں رکھنے کے لیے کافی ہے۔ حتیٰ کہ ایران-اسرائیل تنازعہ کے بڑھنے سے بھی ڈالر کی مجموعی حیثیت پر کوئی خاص اثر نہیں پڑا، کیونکہ امریکہ اس تنازع میں ایک فعال فریق بن گیا ہے۔ مارکیٹ درمیانی مدت میں ڈالر کی خریداری سے باز رہتی ہے، حالانکہ وہ اسے ہر روز فروخت نہیں کرتا ہے۔
منگل کو، یورو/امریکی ڈالر جوڑا بڑھنے کا سلسلہ جاری رکھ سکتا ہے کیونکہ نزول کی ٹرینڈ لائن ٹوٹ گئی ہے، اور تمام مثبت عوامل میں ڈالر کی قیمت پہلے ہی طے ہو چکی ہے۔
5 منٹ کے ٹائم فریم پر، دیکھنے کے لیے متعلقہ لیولز 1.1132–1.1140، 1.1198–1.1218، 1.1267–1.1292، 1.1354–1.1363، 1.1413–1.1424، 1.1414.1414. 1.1527، 1.1561–1.1571، 1.1609، 1.1666، 1.1704، 1.1802۔
منگل کے اہم پروگراموں میں ECB کی صدر کرسٹین لیگارڈ اور فیڈ چیئر جیروم پاول کی تقاریر شامل ہیں۔ اگرچہ ہمیں ان سے کسی بڑی یا نئی معلومات کی توقع نہیں ہے، لیکن ایسے واقعات کو نظر انداز نہیں کیا جانا چاہیے۔ پھر بھی، اثر و رسوخ کے لحاظ سے مشرق وسطیٰ کا تنازعہ مارکیٹ کی اولین ترجیح ہے۔
تجارتی نظام کے کلیدی اصول:
سگنل کی طاقت: سگنل بننے میں جتنا کم وقت لگتا ہے (ایک ریباؤنڈ یا بریک آؤٹ)، سگنل اتنا ہی مضبوط ہوتا ہے۔
غلط سگنلز: اگر کسی لیول کے قریب دو یا زیادہ تجارت کے نتیجے میں غلط سگنلز نکلتے ہیں، تو اس سطح سے آنے والے سگنلز کو نظر انداز کر دینا چاہیے۔
فلیٹ مارکیٹس: فلیٹ حالات میں، جوڑے بہت سے غلط سگنل پیدا کر سکتے ہیں یا کوئی بھی نہیں۔ فلیٹ مارکیٹ کی پہلی علامات پر تجارت بند کرنا بہتر ہے۔
تجارتی اوقات: یورپی سیشن کے آغاز اور امریکی سیشن کے وسط کے درمیان کھلی تجارت، پھر دستی طور پر تمام تجارتوں کو بند کریں۔
MACD سگنلز: گھنٹہ وار ٹائم فریم پر، صرف اچھے اتار چڑھاؤ کے دوران MACD سگنلز کی تجارت کریں اور ٹرینڈ لائنز یا ٹرینڈ چینلز سے تصدیق شدہ واضح رجحان۔
کلوز لیولز: اگر دو لیولز بہت قریب ہیں (5-20 پِپس کے فاصلے پر)، تو ان کو سپورٹ یا ریزسٹنس زون سمجھیں۔
سٹاپ لاس: قیمت کے 15-20 پِپس مطلوبہ سمت میں بڑھنے کے بعد سٹاپ لاس کو بریک ایون پر سیٹ کریں۔
کلیدی چارٹ عناصر:
سپورٹ اور ریزسٹنس لیولز: یہ پوزیشنز کھولنے یا بند کرنے کے لیے ہدف کی سطحیں ہیں اور ٹیک پرافٹ آرڈرز دینے کے لیے پوائنٹس کے طور پر بھی کام کر سکتی ہیں۔
ریڈ لائنز: چینلز یا ٹرینڈ لائنز جو موجودہ رجحان اور ٹریڈنگ کے لیے ترجیحی سمت کی نشاندہی کرتی ہیں۔
MACD انڈیکیٹر (14,22,3): ایک ہسٹوگرام اور سگنل لائن جو تجارتی سگنلز کے ضمنی ذریعہ کے طور پر استعمال ہوتی ہے۔
اہم تقاریر اور رپورٹس، جو مسلسل نیوز کیلنڈر میں نمایاں ہوتی ہیں، کرنسی کے جوڑے کی نقل و حرکت کو نمایاں طور پر متاثر کر سکتی ہیں۔ اس لیے، ان کی رہائی کے دوران، یہ مشورہ دیا جاتا ہے کہ احتیاط کے ساتھ تجارت کریں یا مارکیٹ سے باہر نکلنے پر غور کریں تاکہ پیشگی رجحان کے خلاف قیمتوں میں ممکنہ تیز ردوبدل سے بچا جا سکے۔
فاریکس مارکیٹ میں شروع کرنے والوں کو سمجھنا چاہیے کہ ہر لین دین منافع بخش نہیں ہوگا۔ ٹریڈنگ میں طویل مدتی کامیابی حاصل کرنے کے لیے ایک واضح تجارتی حکمت عملی تیار کرنا اور پیسے کے موثر انتظام کی مشق کرنا بہت ضروری ہے۔