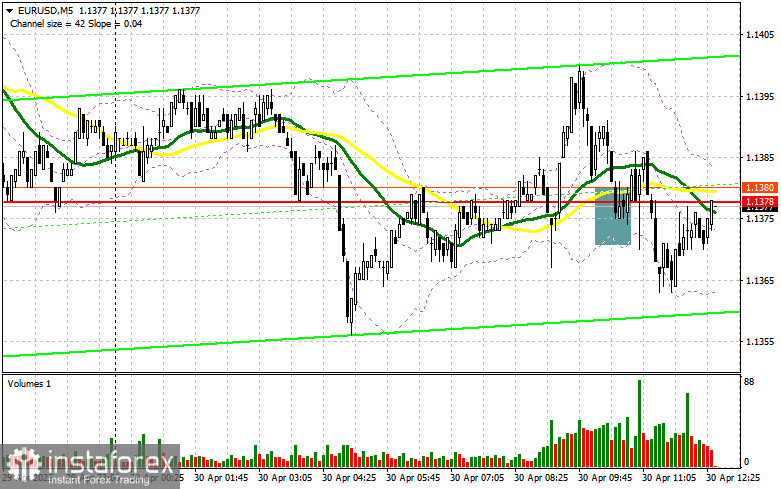
In my morning forecast, I drew attention to the 1.1378 level and planned to base market entry decisions on it. Let's look at the 5-minute chart and analyze what happened. A decline and a false breakout around 1.1378 provided a good entry point for buying the euro, but despite solid economic data, the pair failed to deliver any meaningful growth. The technical picture for the second half of the day has not been revised.
To open long positions on EUR/USD:
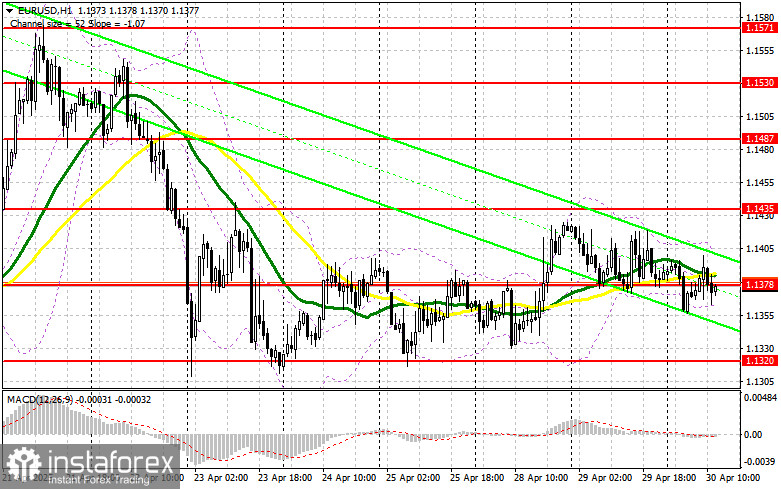
According to the latest data, eurozone GDP grew by 0.4% in the first quarter of this year and exceeded economists' forecasts, but euro buyers completely ignored this statistic. In the second half of the day, equally important U.S. economic data will be released. Figures on April's ADP employment change, as well as preliminary data on U.S. Q1 GDP, are expected. The Core Personal Consumption Expenditures index will complement all the reports. If the figures are strong, pressure on the pair will clearly increase at the end of the month, and I plan to take advantage of this. In this regard, I intend to act only from what I consider to be stronger support at 1.1320. A false breakout there will serve as a reason to buy EUR/USD in anticipation of a continuation of the bullish market and a return to the 1.1378 level, around which today's trading is centered. A breakout and retest of this range will confirm a proper entry point for long positions, with an upward move toward the 1.1435 area. The furthest target will be the 1.1487 level, where I plan to take profit. If EUR/USD declines and there is no buying activity around 1.1320, the pair will break out of the sideways channel, which could lead to a stronger downward move. In that case, bears will be able to reach 1.1267. Only after a false breakout there will I consider buying the euro. I plan to open long positions immediately on a rebound from 1.1206, targeting an intraday upward correction of 30–35 points.
To open short positions on EUR/USD:
If the euro rises on the back of weak U.S. GDP statistics, which is quite likely, bears will need to assert themselves around 1.1435. Only a false breakout there will justify short positions against the trend, targeting a drop toward the 1.1378 support, where trading is currently taking place. The moving averages are also located there and are supporting the bulls. A breakout and consolidation below this range will be a suitable selling signal for a move toward 1.1320. The furthest target will be the 1.1267 area, where I plan to take profit. A test of this level would break the bullish market structure. If EUR/USD moves upward in the second half of the day and bears are inactive around 1.1435, buyers may succeed in pushing the pair up to 1.1487. I will sell there only after a failed consolidation. I plan to open short positions immediately on a rebound from 1.1530, targeting a 30–35 point intraday correction.
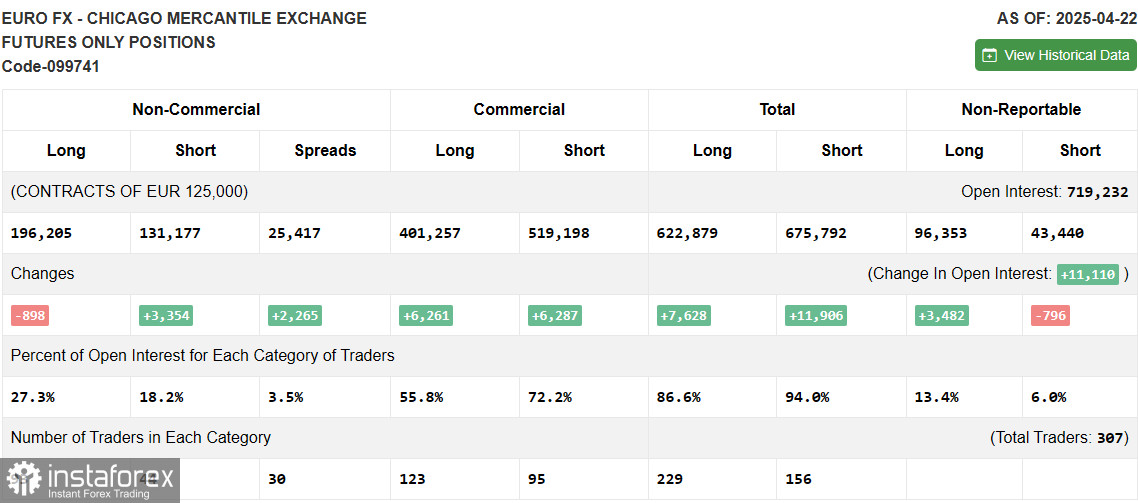
The COT (Commitment of Traders) report for April 22 showed an increase in short positions and a reduction in long ones. Considering that the European Central Bank is now almost openly indicating further rate cuts, this factor is currently preventing the euro from continuing to rise against the U.S. dollar. Easing trade tensions under Donald Trump and a possible compromise with China on a trade deal are gradually bringing U.S. dollar buyers back into the market. In the near future, the decisive factor will be U.S. economic growth figures for Q1 and the April labor market report. The COT report shows that long non-commercial positions fell by 898 to 196,205, while short non-commercial positions rose by 3,354 to 131,177. As a result, the gap between long and short positions narrowed by 2,493.
Indicator signals:
Moving Averages
Trading is taking place around the 30- and 50-day moving averages, which indicates market uncertainty.
Note: The period and prices of the moving averages are considered by the author on the H1 chart and differ from the classic definitions of daily moving averages on the D1 chart.
Bollinger Bands
In case of a decline, the lower boundary of the indicator around 1.1378 will act as support.
Indicator descriptions • Moving average (identifies the current trend by smoothing volatility and noise). Period – 50. Marked in yellow on the chart. • Moving average (identifies the current trend by smoothing volatility and noise). Period – 30. Marked in green on the chart. • MACD indicator (Moving Average Convergence/Divergence – convergence/divergence of moving averages): Fast EMA – period 12, Slow EMA – period 26, SMA – period 9. • Bollinger Bands. Period – 20. • Non-commercial traders – speculators such as individual traders, hedge funds, and large institutions using the futures market for speculative purposes and meeting specific criteria. • Long non-commercial positions represent the total long open positions of non-commercial traders. • Short non-commercial positions represent the total short open positions of non-commercial traders. • Net non-commercial position is the difference between short and long positions of non-commercial traders.