 Stay
Stay 
Trading Conditions
Products
Tools


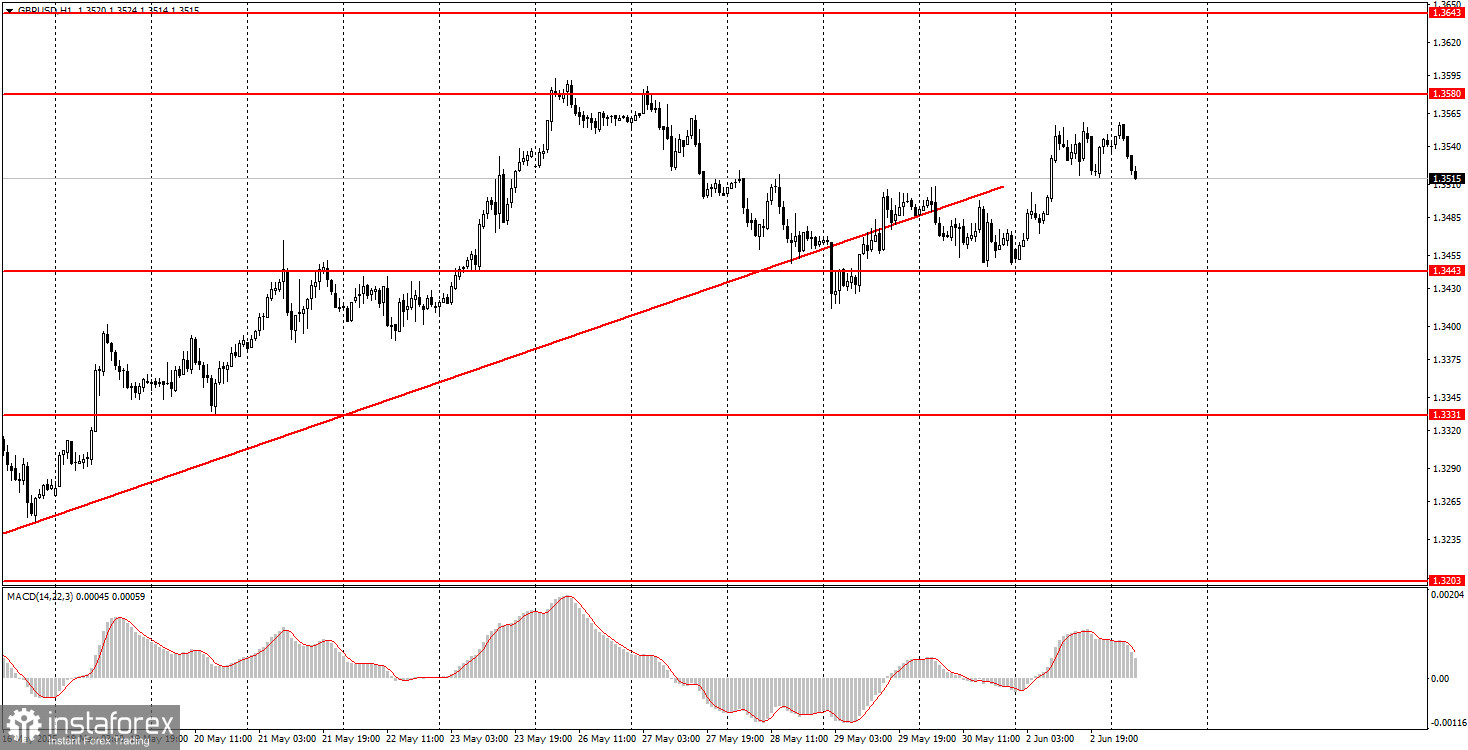
The GBP/USD pair also traded higher throughout Monday. However, the overall technical picture of the British pound differs slightly from that of the euro. Yes, the pound is rising just like the euro, and even more strongly. However, the euro broke its previous high yesterday on the hourly timeframe, while the pound has not. This could indicate an overbought condition in the British currency. Recall that the previously broken ascending trendline signals a potential trend reversal. Of course, a strong fundamental background can override the technical picture — something we've been observing regularly in recent months.
Furthermore, many significant macroeconomic indicators will be released in the U.S. this week. If weaker than expected, each major report could trigger a new decline in the dollar simply because the market eagerly reacts to any negative factor for the greenback. However, if U.S. macroeconomic data do not disappoint and Trump takes a week-long pause in escalating the trade war, the dollar might attempt to strengthen again.
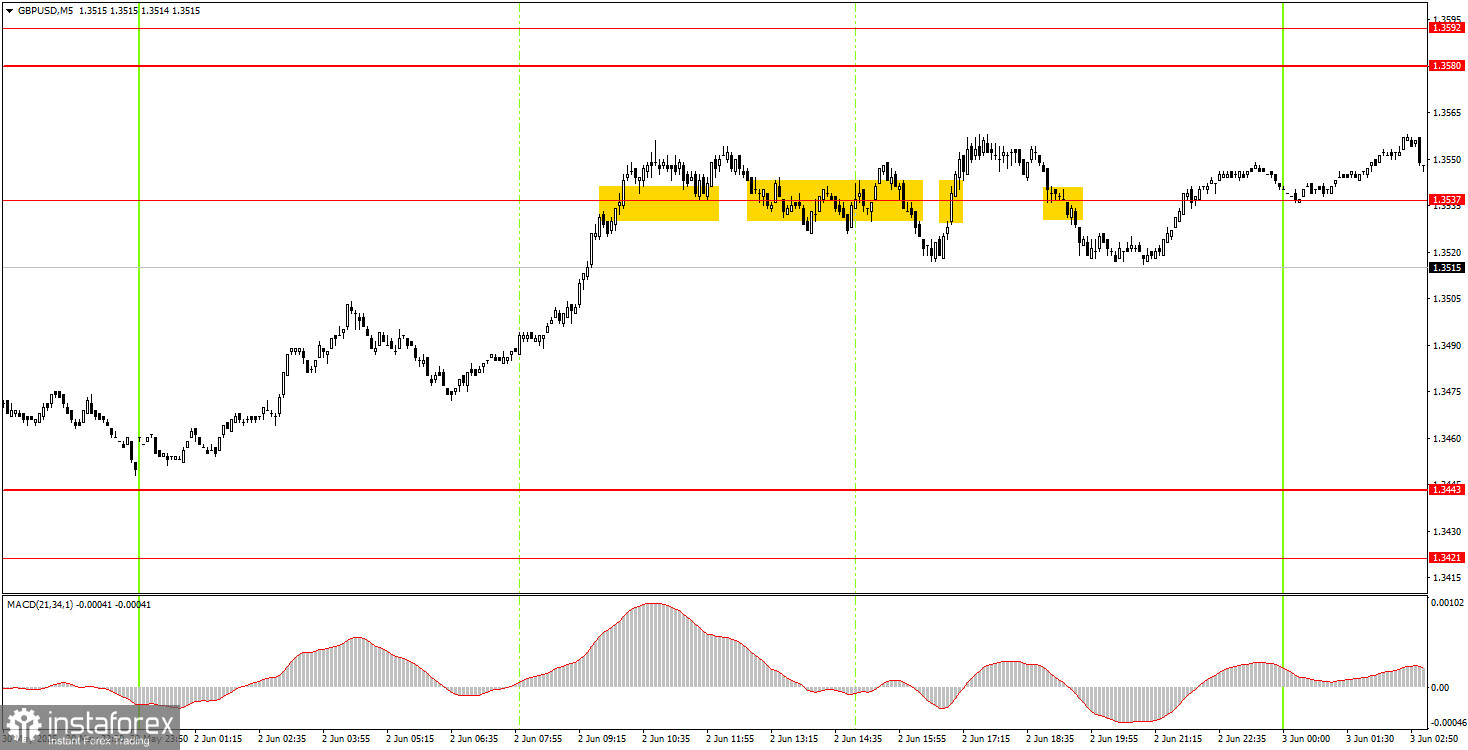
Several trading signals were formed in the 5-minute timeframe on Monday, but they were not ideal. Unfortunately, as with the euro, there was no signal to buy at the very start of the upward movement, and around the 1.3537 level, only false signals were generated. By the end of the day, we revised this level to 1.3518. Therefore, a rebound from this level could trigger a new upward movement today.
In the hourly timeframe, the GBP/USD pair focuses solely on Donald Trump and remains highly skeptical of his policies. While there are signs of reduced trade tension, the market is not particularly optimistic, and signs of rising tension are more prevalent. Last week, the dollar slightly strengthened, but that turned out to be only a technical correction, and continuing that correction would require positive news on the trade war front — something currently lacking.
The GBP/USD pair may start a new downward movement on Tuesday, given that the trendline has been breached. However, few fundamental factors support such a movement. We still maintain a skeptical view regarding the growth of the U.S. currency, but it's better to trade now based on technical factors.
On the 5-minute timeframe, the following levels can be used for trading: 1.3043, 1.3102–1.3107, 1.3203–1.3211, 1.3259, 1.3329–1.3331, 1.3421–1.3443, 1.3518, 1.3580–1.3592, 1.3652–1.3660, 1.3695. On Tuesday, no significant events or reports are scheduled for the UK; in the U.S., the JOLTs report will be released. However, it is only indirectly related to the unemployment rate, and the market will be more focused on unemployment figures rather than the number of job openings.
Support and Resistance Levels: These are target levels for opening or closing positions and can also serve as points for placing Take Profit orders.
Red Lines: Channels or trendlines indicating the current trend and the preferred direction for trading.
MACD Indicator (14,22,3): A histogram and signal line used as a supplementary source of trading signals.
Important Events and Reports: Found in the economic calendar, these can heavily influence price movements. Exercise caution or exit the market during their release to avoid sharp reversals.
Forex trading beginners should remember that not every trade will be profitable. Developing a clear strategy and practicing proper money management are essential for long-term trading success.
InstaForex analytical reviews will make you fully aware of market trends! Being an InstaForex client, you are provided with a large number of free services for efficient trading.


