Thursday Trade Review:
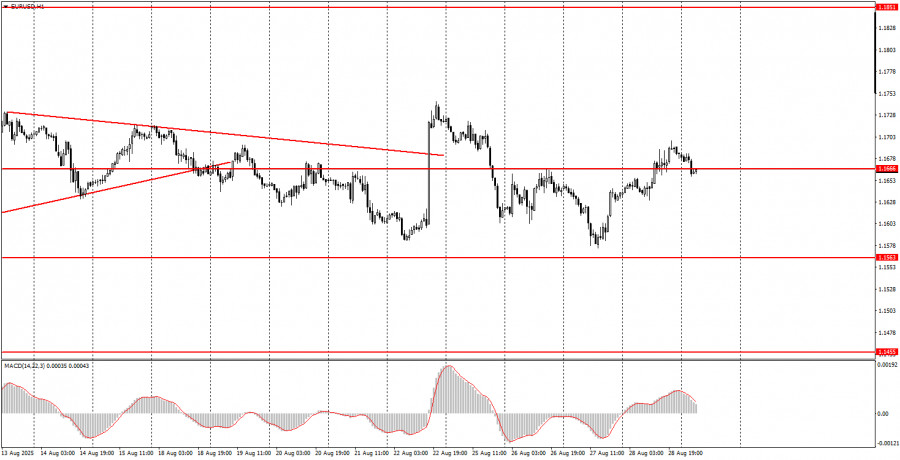
1H Chart of EUR/USD
On Thursday, the EUR/USD currency pair maintained its bullish bias within a sideways movement that's been underway for about two weeks. This is not surprising, as ranges (flats) are common on the market. Neither last week nor this week have there been any significant macroeconomic releases in the EU or the US. Moreover, the news that has reached traders has pointed primarily to one thing: that the dollar should be sold. The fact that we haven't seen a new wave of dollar selling yet indicates a certain pause in the market—in other words, a flat. Traders are simply accumulating energy ahead of a new trend. Yesterday, it was reported that the US economy grew by 3.3% in the second quarter, not 3%. However, as we've said, there is little that's positive for the dollar in this news, because apart from GDP, other US economic indicators are mostly falling rather than rising.
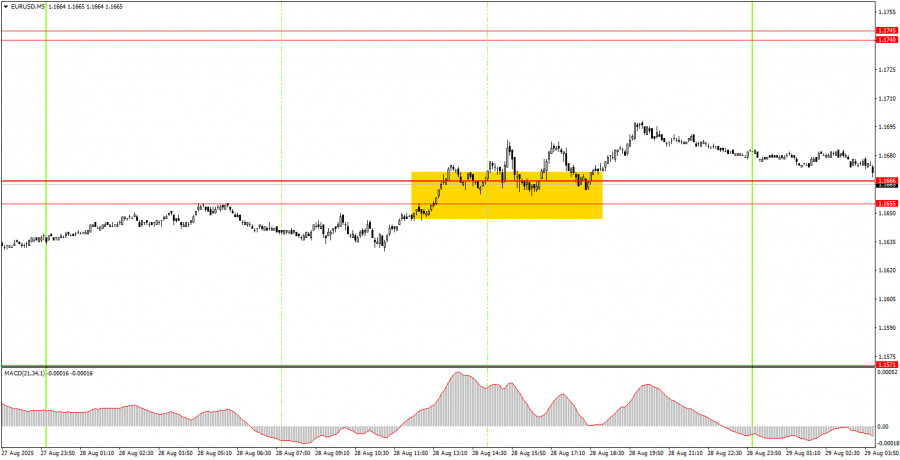
5M Chart of EUR/USD
On the five-minute timeframe on Thursday, several trading signals were generated. First, the pair overcame the key area of 1.1655–1.1666 and then bounced off it several times from above. Thus, novice traders had an opportunity to open long positions. Profit-taking on these trades was limited to about 10–15 pips on Thursday, but the trade setup itself was promising, so holding the position into Friday or even carrying it over to the next week would make sense.
How to Trade on Friday:
On the hourly timeframe, the EUR/USD pair has every chance to resume the uptrend that began at the start of the current year. The fundamental and macroeconomic background remains negative for the US dollar. However, in the past two weeks, we have still been seeing almost horizontal (sideways) movement. In our opinion, as before, the dollar can only hope for technical corrections.
On Friday, the EUR/USD pair may continue to trade with low volatility, as there are still very few significant events scheduled for today. A break above the 1.1655–1.1666 area would allow traders to expect growth, with a target of 1.1740. A consolidation back below 1.1655–1.1666 would allow for considering shorts with a target of 1.1571.
On the five-minute timeframe, focus on the following levels: 1.1198–1.1218, 1.1267–1.1292, 1.1354–1.1363, 1.1413, 1.1455–1.1474, 1.1527, 1.1552–1.1563–1.1571, 1.1655–1.1666, 1.1740–1.1745, 1.1808, 1.1851, 1.1908.
Germany is scheduled to release data on retail sales, inflation, and unemployment on Friday. These are interesting reports, but not the most important ones. In the US, updates include the PCE report, personal income/expenditure figures, and the University of Michigan Consumer Sentiment Index—also not the top-tier releases.
Core Trading System Rules:
- Signal Strength: The shorter the time it takes for a signal to form (a rebound or breakout), the stronger the signal.
- False Signals: If two or more trades near a level result in false signals, subsequent signals from that level should be ignored.
- Flat Markets: In flat conditions, pairs may generate many false signals or none at all. It's better to stop trading at the first signs of a flat market.
- Trading Hours: Open trades between the start of the European session and the middle of the US session, then manually close all trades.
- MACD Signals: On the hourly timeframe, trade MACD signals only during periods of good volatility and a clear trend confirmed by trendlines or trend channels.
- Close Levels: If two levels are too close (5–20 pips apart), treat them as a support or resistance zone.
- Stop Loss: Set a Stop Loss to breakeven after the price moves 15 pips in the desired direction.
Key Chart Elements:
Support and Resistance Levels: These are target levels for opening or closing positions and can also serve as points for placing Take Profit orders.
Red Lines: Channels or trendlines indicating the current trend and the preferred direction for trading.
MACD Indicator (14,22,3): A histogram and signal line used as a supplementary source of trading signals.
Important Events and Reports: Found in the economic calendar, these can heavily influence price movements. Exercise caution or exit the market during their release to avoid sharp reversals.
Forex trading beginners should remember that not every trade will be profitable. Developing a clear strategy and practicing proper money management are essential for long-term trading success.


