Wednesday Trade Review:
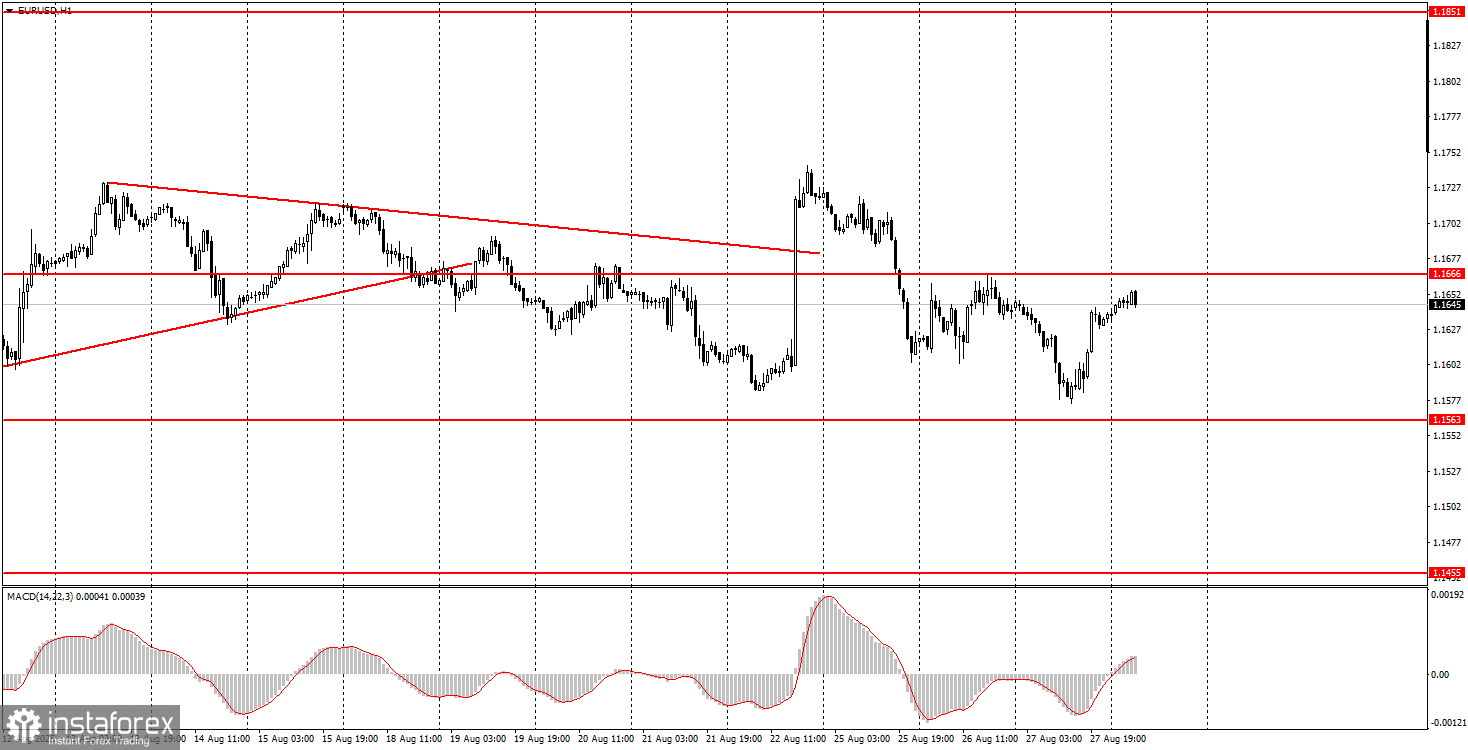
1H Chart of EUR/USD

On Wednesday, the EUR/USD currency pair exhibited a particularly interesting trading pattern. Even though there was practically no macroeconomic news during the day (and the overall fundamental backdrop remains sharply negative for the US dollar, worsening over time), the market was buying the American currency in the first half of the day. In the second half, however, everything fell into place, and the dollar started to weaken. Still, this decline is clearly insufficient given the current situation. Recall that just this week, Donald Trump raised tariffs on India and also started a new round of battles with the Federal Reserve. This time, the sanctions concerned New Delhi's cooperation with Moscow. Trump wants to end the conflict between Ukraine and Russia in order to win the Nobel Peace Prize, so he is ready to punish countries that buy oil, gas, and weapons from Russia. As for the new conflict with the Fed, Trump decided he could fire FOMC member Lisa Cook—while forgetting he has no such authority. Lisa Cook refused to leave her post.
5M Chart of EUR/USD
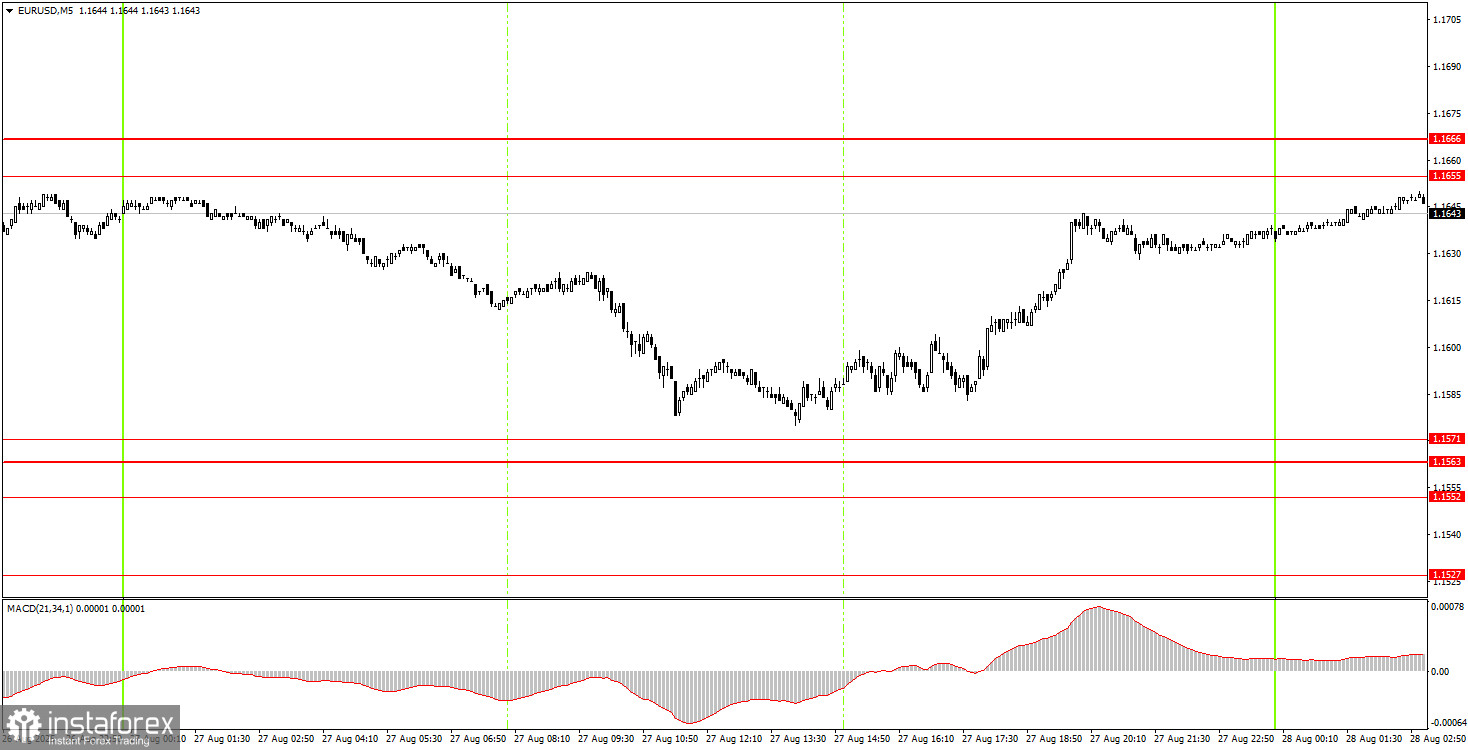
On the 5-minute timeframe on Wednesday, two excellent trade signals could have formed, but ultimately, neither materialized. On Tuesday evening, the price rebounded several times from the 1.1655–1.1666 area, so a short position could only have been opened at that time. On Wednesday, before the decline, the price did not retest that area. Unfortunately, it also fell just a few pips short of the 1.1552–1.1571 area. It then returned to the range of 1.1655–1.1666.
How to Trade on Thursday:
On the hourly timeframe, EUR/USD still has every chance to resume the uptrend that's been forming since the start of this year. The fundamental and macroeconomic background remains dismal for the US dollar, but over the past two weeks, we have observed almost sideways action nonetheless. In our view, as always, the US currency can only count on technical corrections.
On Thursday, the EUR/USD may again exhibit low volatility, as there are few important events scheduled for the day. A bounce from the 1.1655–1.1666 area would again allow traders to look for a drop toward 1.1571. Breaking above 1.1655–1.1666 opens up long opportunities.
On the 5-minute timeframe, watch the levels: 1.1198–1.1218, 1.1267–1.1292, 1.1354–1.1363, 1.1413, 1.1455–1.1474, 1.1527, 1.1552–1.1563–1.1571, 1.1655–1.1666, 1.1740–1.1745, 1.1808, 1.1851, 1.1908. For Thursday in the US, only the second estimate of Q2 GDP is scheduled, and that's it for the day's events. The second estimate is objectively the least interesting for traders, so we don't expect any real market reaction.
Core Trading System Rules:
- Signal Strength: The shorter the time it takes for a signal to form (a rebound or breakout), the stronger the signal.
- False Signals: If two or more trades near a level result in false signals, subsequent signals from that level should be ignored.
- Flat Markets: In flat conditions, pairs may generate many false signals or none at all. It's better to stop trading at the first signs of a flat market.
- Trading Hours: Open trades between the start of the European session and the middle of the US session, then manually close all trades.
- MACD Signals: On the hourly timeframe, trade MACD signals only during periods of good volatility and a clear trend confirmed by trendlines or trend channels.
- Close Levels: If two levels are too close (5–20 pips apart), treat them as a support or resistance zone.
- Stop Loss: Set a Stop Loss to breakeven after the price moves 15 pips in the desired direction.
Key Chart Elements:
Support and Resistance Levels: These are target levels for opening or closing positions and can also serve as points for placing Take Profit orders.
Red Lines: Channels or trendlines indicating the current trend and the preferred direction for trading.
MACD Indicator (14,22,3): A histogram and signal line used as a supplementary source of trading signals.
Important Events and Reports: Found in the economic calendar, these can heavily influence price movements. Exercise caution or exit the market during their release to avoid sharp reversals.
Forex trading beginners should remember that not every trade will be profitable. Developing a clear strategy and practicing proper money management are essential for long-term trading success.