Analysis of Trades and Trading Tips for the Japanese Yen
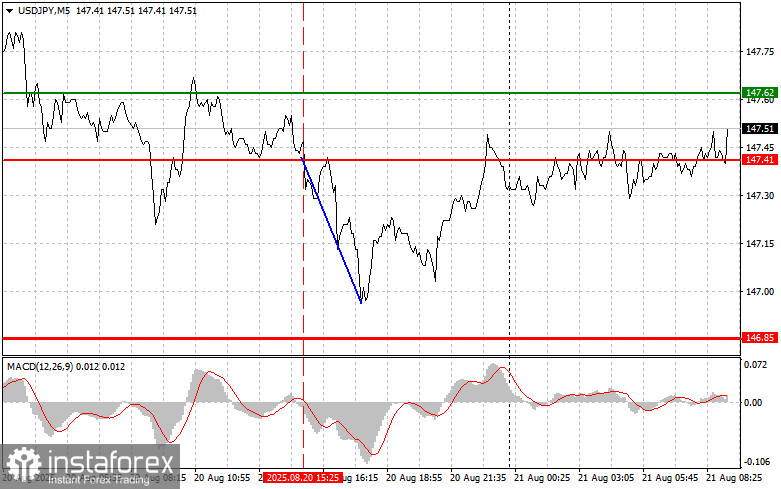
The test of the 147.41 price level occurred when the MACD indicator had just started moving down from the zero line, which confirmed the correct entry point for selling the dollar. As a result, the pair dropped by 40 points.
The Federal Reserve minutes confirmed that almost all participants had reached a consensus to keep the key interest rate at 4.25–4.50%. However, it should be noted that just a few days after the meeting, strong pressure from U.S. President Donald Trump influenced the stance of several Fed officials, pushing them toward a more dovish position. Therefore, yesterday's minutes had little to do with what is happening.
Today's data on Japan's Manufacturing PMI showed a contraction in August, which was offset by growth in the Services PMI, which remained above the 50-point threshold. This balance maintained stability in the USD/JPY pair. The balance of forces reflects the complex state of the Japanese economy. On the one hand, the manufacturing sector is struggling, likely due to weaker external demand and global economic challenges. The contraction in the manufacturing PMI highlights these issues and signals potential weakness in the months ahead.
On the other hand, the services sector shows resilience, supporting overall economic growth. A reading above 50 points indicates expansion in services, offsetting negative trends in manufacturing. This may be linked to domestic demand, tourism, or other factors supporting activity in the services sector.
Investors will closely monitor further economic data from Japan to gauge the trajectory of its economy and, consequently, the direction of the USD/JPY pair. Key indicators will be inflation, labor market data, and the Bank of Japan's rhetoric on monetary policy.
For intraday strategy, I will focus primarily on Scenarios #1 and #2.
Buy Scenario
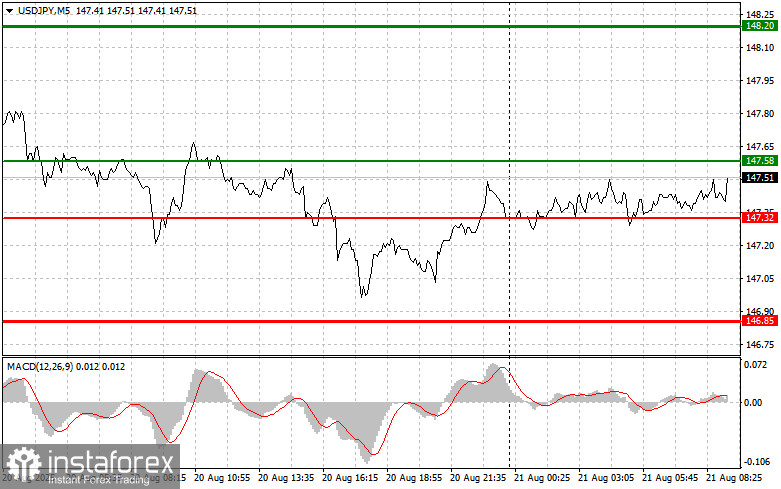
Scenario No. 1: I plan to buy USD/JPY today if the entry point around 147.58 is reached (green line on the chart), targeting growth toward 148.20 (thicker green line on the chart). Around 148.20, I plan to exit purchases and open sell positions in the opposite direction, expecting a 30–35 point move from that level. It is best to return to buying the pair during corrections and significant pullbacks of USD/JPY. Important: Before buying, make sure the MACD indicator is above the zero line and just beginning to rise from it.
Scenario No. 2: I also plan to buy USD/JPY today in case of two consecutive tests of the 147.32 price level when the MACD indicator is in the oversold area. This will limit the pair's downside potential and lead to an upward reversal. Growth toward the opposite levels of 147.58 and 148.20 can be expected.
Sell Scenario
Scenario No. 1: I plan to sell USD/JPY today only after the price updates the 147.32 level (red line on the chart), which will lead to a rapid decline in the pair. The key target for sellers will be 146.85, where I plan to exit sales and immediately open buy positions in the opposite direction, expecting a rebound of 20–25 points from that level. It is better to sell as high as possible. Important: Before selling, make sure the MACD indicator is below the zero line and just beginning to move downward from it.
Scenario No. 2: I also plan to sell USD/JPY today in case of two consecutive tests of the 147.58 price level when the MACD indicator is in the overbought area. This will limit the pair's upward potential and lead to a reversal downward. A decline toward the opposite levels of 147.32 and 146.85 can be expected.
What's on the Chart:
- The thin green line represents the entry price where the trading instrument can be bought.
- The thick green line indicates the expected price level where a Take Profit order can be placed, or profits can be manually secured, as further price growth above this level is unlikely.
- The thin red line represents the entry price where the trading instrument can be sold.
- The thick red line indicates the expected price level where a Take Profit order can be placed, or profits can be manually secured, as further price decline below this level is unlikely.
- The MACD indicator should be used to assess overbought and oversold zones when entering the market.
Important Notes:
- Beginner Forex traders should exercise extreme caution when making market entry decisions. It is advisable to stay out of the market before the release of important fundamental reports to avoid exposure to sharp price fluctuations. If you choose to trade during news releases, always use stop-loss orders to minimize potential losses. Trading without stop-loss orders can quickly wipe out your entire deposit, especially if you neglect money management principles and trade with high volumes.
- Remember, successful trading requires a well-defined trading plan, similar to the one outlined above. Making impulsive trading decisions based on the current market situation is a losing strategy for intraday traders.