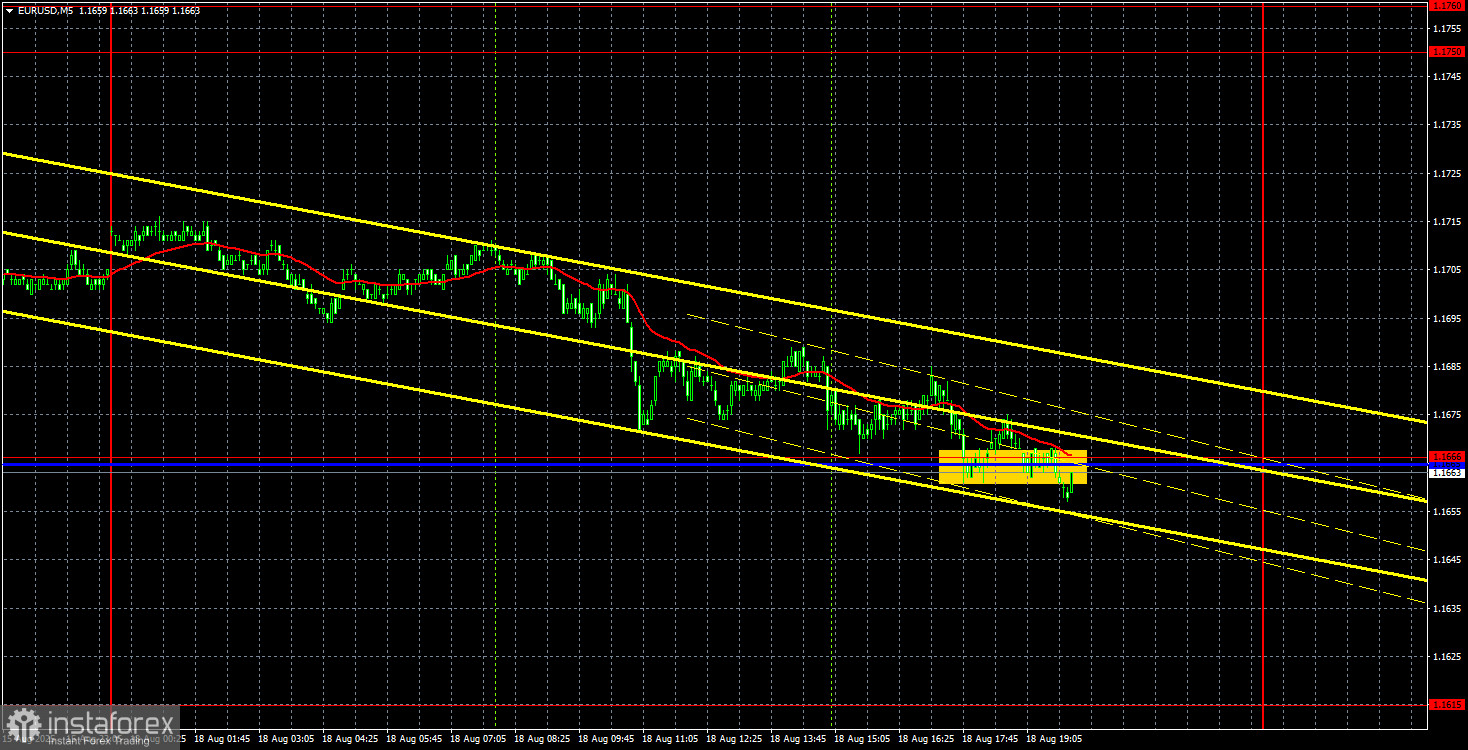
EUR/USD 5-Minute Analysis
The EUR/USD currency pair showed ultra-weak movements on Friday and Monday. There was hope that traders would partially recover during the U.S. session yesterday, especially after the historic meeting between Vladimir Putin and Donald Trump over the weekend. However, those hopes were ultimately not fulfilled. Thus, movement has been lacking recently, though the upward trend remains in place, as the trendline indicates.
At this point, the price has returned to the trendline for the third time. If it bounces again, the movement to the upside will resume immediately. If the price consolidates below the trendline, the dollar may strengthen slightly, but there will be no talk of forming a prolonged and strong downtrend. In any case, the Senkou Span B line remains below, serving as strong support.
The macroeconomic and fundamental background was absent on Monday, so traders had nothing to react to during the day.
On the 5-minute timeframe, the only trading signal was formed in the evening, when the price bounced from the critical line and the 1.1666 level. Therefore, technically, long positions with a target of 1.1750–1.1760 remain valid. If this level and the line are broken, the decline may continue with a target of 1.1615.
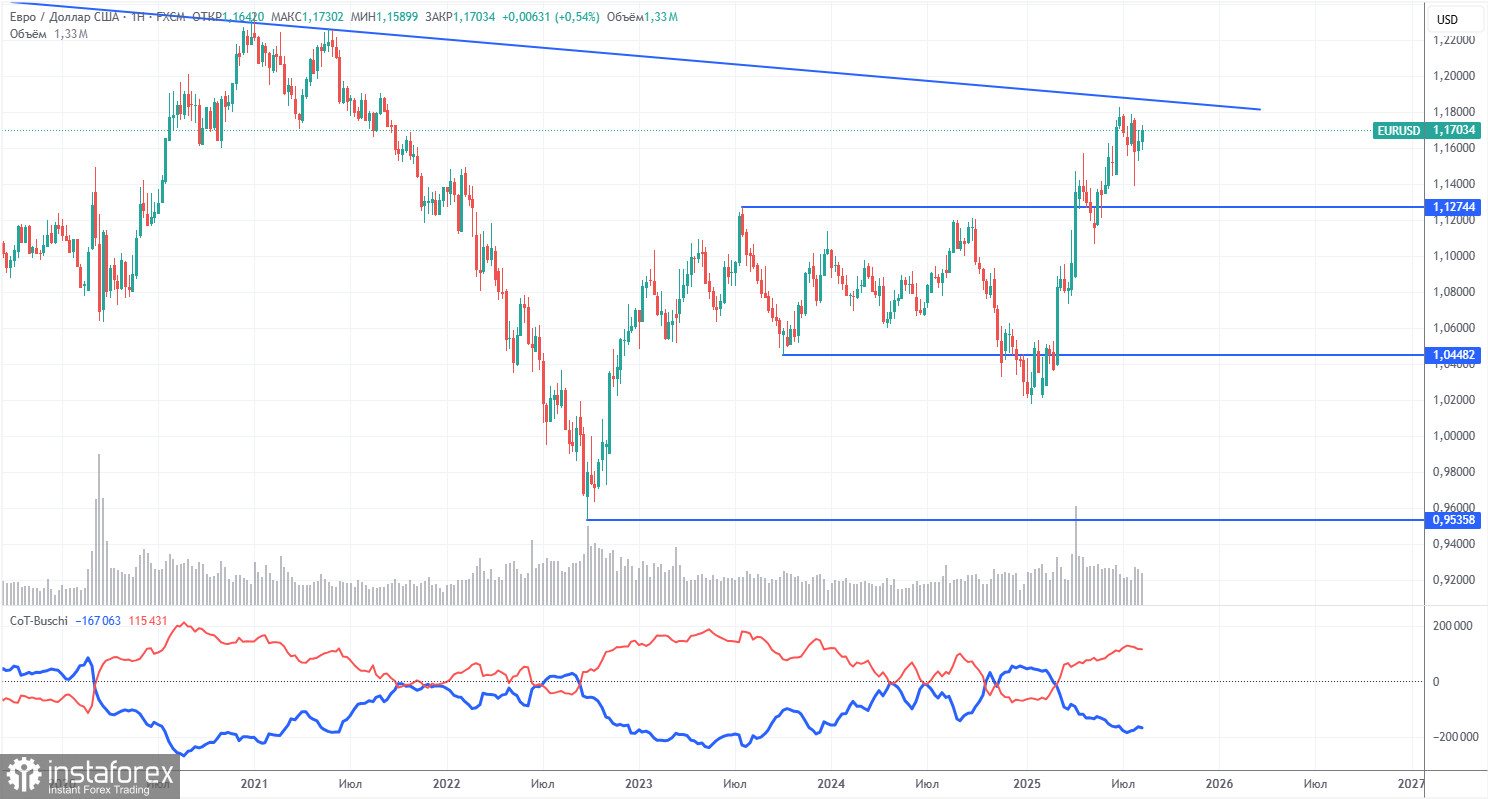
COT Report
The latest COT report is dated August 12. The chart above shows clearly that the net position of non-commercial traders has long been bullish, while the bears only briefly gained an advantage at the end of 2024 before quickly losing it. Since Trump took office as U.S. president, only the dollar has been falling. We cannot say with 100% certainty that the decline of the American currency will continue, but the current global developments suggest exactly that scenario.
We still see no fundamental factors supporting the strengthening of the European currency, but there remains one very weighty factor for the decline of the U.S. dollar. The global downtrend is still intact, but what significance does it have now where the price moved over the past 17 years? Once Trump ends his trade wars, the dollar may begin to rise, but recent events show that the war will continue in one form or another.
The positioning of the red and blue indicator lines continues to signal the preservation of a bullish trend. During the last reporting week, the number of longs in the "non-commercial" group decreased by 1,000, while shorts decreased by 500. Accordingly, the net position declined by 500 contracts over the week, which is a negligible change.
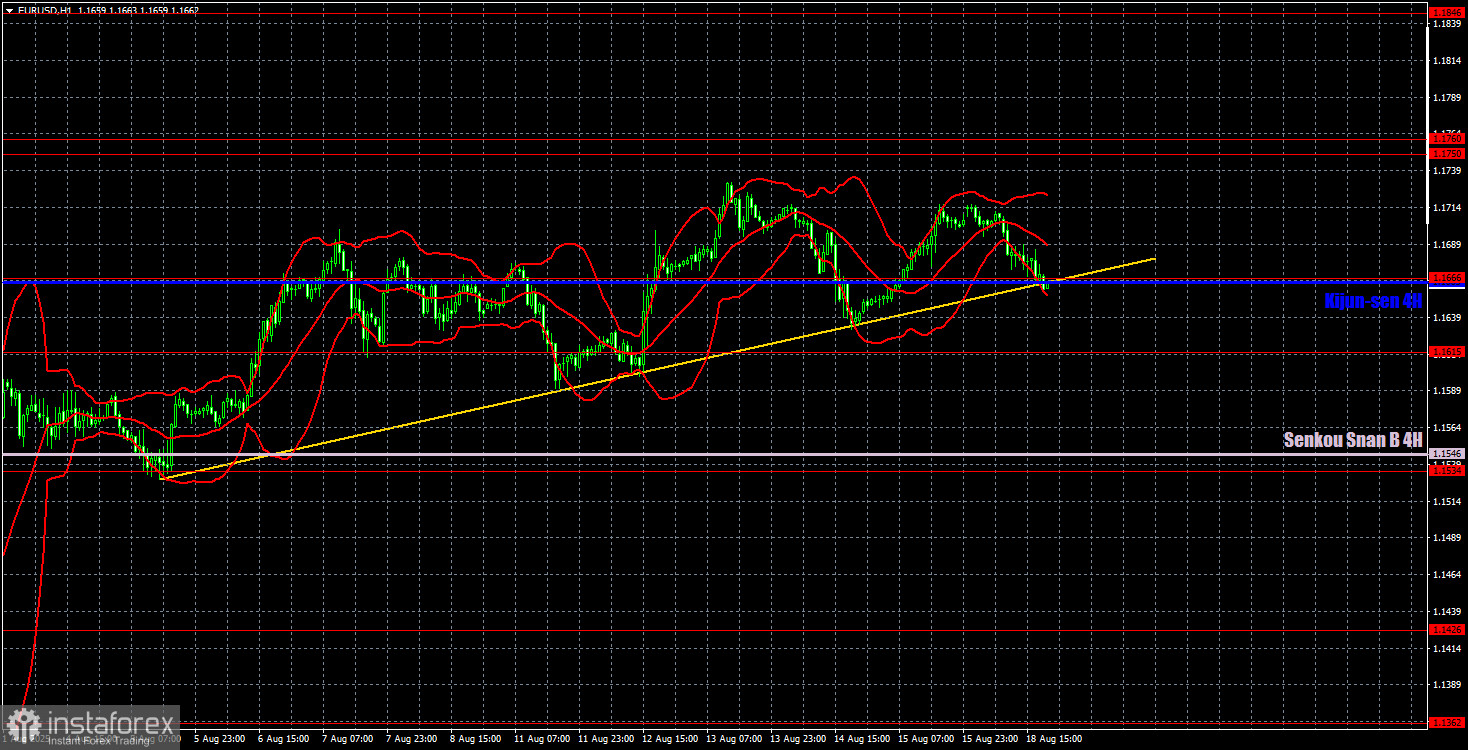
EUR/USD 1-Hour Analysis
On the hourly timeframe, EUR/USD continues forming a new upward trend. A new wave of growth began after the price bounced from the Senkou Span B line on the daily chart. Thus, the dollar corrected very technically, while the upward trend was preserved. At this point, the market is resting, clearly awaiting important events. However, a bounce from the trendline could trigger another upward move.
For August 19, we highlight the following levels for trading: 1.1092, 1.1147, 1.1185, 1.1234, 1.1274, 1.1362, 1.1426, 1.1534, 1.1615, 1.1666, 1.1750–1.1760, 1.1846–1.1857, as well as the Senkou Span B line (1.1546) and the Kijun-sen line (1.1664). The Ichimoku indicator lines can move during the day, which should be taken into account when determining trading signals. Do not forget to place a Stop Loss at breakeven if the price moves 15 pips in the right direction. This will protect against possible losses if the signal turns out to be false.
On Tuesday, the macroeconomic calendar will once again be practically empty. Several reports will be released in the U.S., but we consider them secondary. Thus, the market may show only a minimal reaction to U.S. data, while overall it remains in a waiting mode.
Trading Recommendations
On Tuesday, the pair may resume upward movement if it bounces from the trendline or the critical line. In this case, longs will once again be relevant. If the trendline is broken, short positions can be opened with targets at 1.1615 and the Senkou Span B line.
Illustration Explanations:
- Support and resistance price levels – thick red lines where movement may end. They are not trading signal sources.
- Kijun-sen and Senkou Span B lines—These are strong Ichimoku indicator lines transferred to the hourly timeframe from the 4-hour one.
- Extremum levels – thin red lines where the price has previously rebounded. These act as trading signal sources.
- Yellow lines – trend lines, trend channels, and other technical patterns.
- COT Indicator 1 on the charts – the size of the net position for each category of traders.