empty
 
 
30.04.2023 12:39 PM
Weekly review of GBP/USD for April 24-28, 2023

This image is no longer relevant

Weekly Review :

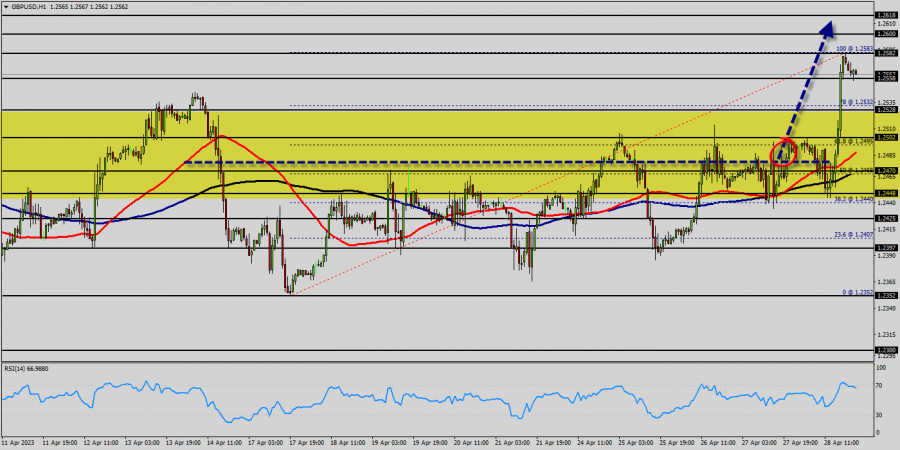
The GBP/USD pair steep decline spells for a capitulation event underway from the levels 1.2470 and 1.2448. More price decline is likely to occur, but traders should consider the bearish thesis event until 1.2502 is broken. The GBP/USD pair dropped sharply from the level of 1.2470 towards 1.2425. Now, the price is set at 1.2425. On the H1 chart, the resistance of GBP/USD pair is seen at the level of 1.2352 and 1.2502. It should be noted that volatility is very high for that the GBP/USD pair is still moving between 1.2425 and 1.2352 in coming hours. Moreover, the price spot of 1.2470 remains a significant resistance zone. Therefore, there is a possibility that the GBP/USD pair will move downside and the structure of a fall does not look corrective; in order to indicate the bearish opportunity below 1.2470, sell below 1.2470 with the first target at 1.2352 so as to test last week's bottom. Also, it should be noticed that support 1 is seen at the level of 1.2352 which coincides the daily double bottom. So, we expect the price to set below the strong resistance at the level of 1.2470; because the price is in a bearish channel now. The RSI starts signaling a downward trend. Consequently, the market is likely to show signs of a bearish trend. Additionally, if the GBP/USD pair is able to break out the bottom at 1.2352, the market will decline further to 1.2312 in order to test the weekly support 2.

The GBP/USD pair steep decline spells for a capitulation event underway from the levels 1.2470 and 1.2448. More price decline is likely to occur, but traders should consider the bearish thesis event until 1.2502 is broken.

The GBP/USD pair dropped sharply from the level of 1.2470 towards 1.2425. Now, the price is set at 1.2425. On the H1 chart, the resistance of GBP/USD pair is seen at the level of 1.2352 and 1.2502. It should be noted that volatility is very high for that the GBP/USD pair is still moving between 1.2425 and 1.2352 in coming hours. Moreover, the price spot of 1.2470 remains a significant resistance zone.

The GBP/USD pair steep decline spells for a capitulation event underway from the levels 1.2470 and 1.2448. More price decline is likely to occur, but traders should consider the bearish thesis event until 1.2502 is broken. The GBP/USD pair dropped sharply from the level of 1.2470 towards 1.2425. Now, the price is set at 1.2425.

On the H1 chart, the resistance of GBP/USD pair is seen at the level of 1.2352 and 1.2502. It should be noted that volatility is very high for that the GBP/USD pair is still moving between 1.2425 and 1.2352 in coming hours.

Moreover, the price spot of 1.2470 remains a significant resistance zone. Therefore, there is a possibility that the GBP/USD pair will move downside and the structure of a fall does not look corrective; in order to indicate the bearish opportunity below 1.2470, sell below 1.2470 with the first target at 1.2352 so as to test last week's bottom. Also, it should be noticed that support 1 is seen at the level of 1.2352 which coincides the daily double bottom.

So, we expect the price to set below the strong resistance at the level of 1.2470; because the price is in a bearish channel now. The RSI starts signaling a downward trend. Consequently, the market is likely to show signs of a bearish trend. Additionally, if the GBP/USD pair is able to break out the bottom at 1.2352, the market will decline further to 1.2312 in order to test the weekly support 2.

Therefore, there is a possibility that the GBP/USD pair will move downside and the structure of a fall does not look corrective; in order to indicate the bearish opportunity below 1.2470, sell below 1.2470 with the first target at 1.2352 so as to test last week's bottom.

Also, it should be noticed that support 1 is seen at the level of 1.2352 which coincides the daily double bottom. So, we expect the price to set below the strong resistance at the level of 1.2470; because the price is in a bearish channel now.

The RSI starts signaling a downward trend. Consequently, the market is likely to show signs of a bearish trend. Additionally, if the GBP/USD pair is able to break out the bottom at 1.2352, the market will decline further to 1.2312 in order to test the weekly support 2.

Ringkasan
Urgensi
Analitik
Mourad El Keddani
Mulai berdagang
Dapatkan keuntungan dari perubahan nilai mata uang kripto dengan InstaForex.
Unduh MetaTrader 4 dan buka perdagangan pertama Anda.
  • Grand Choice
    Contest by
    InstaForex
    InstaForex always strives to help you
    fulfill your biggest dreams.
    GABUNG KONTES
  • Chancy Deposit
    Isi akun Anda sebesar $3000 dan dapatkan $5000 lebih banyak!
    Pada November kami mengundi $5000 dalam promo Chancy Deposit!
    Dapatkan kesempatan untuk menang dengan melakukan deposit sebesar $3000 pada akun trading Anda. Setelah memenuhi persyaratan ini, Anda telah menjadi partisipan promo.
    GABUNG KONTES
  • Trade Wise, Win Device
    Top up akun anda dengan dana minimal $500, daftar kontes, dan dapatkan peluang untuk memenangkan perangkat seluler.
    GABUNG KONTES
  • 30% Bonus
    Raih bonus 30% setiap kali anda top up
    DAPATKAN BONUS

Artikel yang direkomendasikan

Tidak bisa bicara sekarang?
Tanyakan pertanyaan anda lewat chat.
Widget callback