GBP/USD
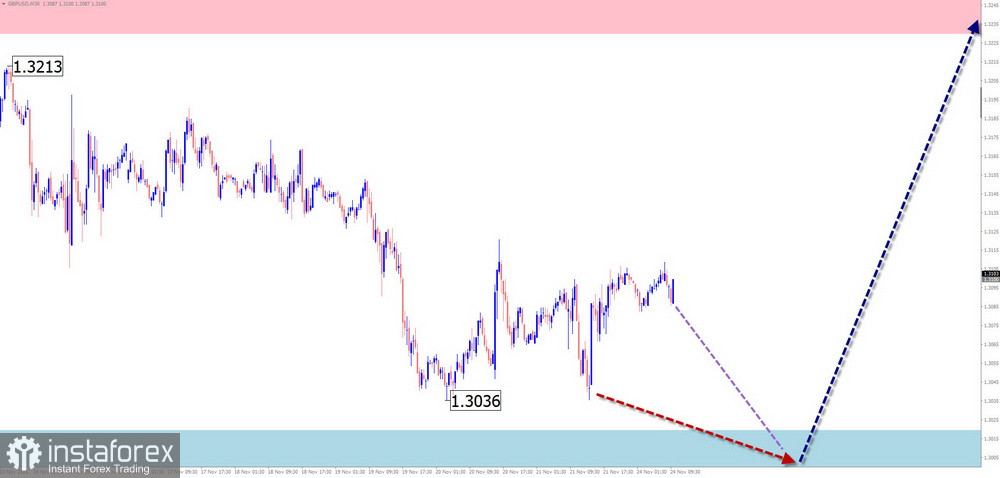
Brief Analysis: Since the beginning of this year, the GBP/USD main pair has formed an upward wave. Over the past six months, prices have formed a stretched corrective plane. Since November 4, a new upward wave structure with reversal potential has been forming in the sideways plane.
Weekly Forecast: In the next couple of days, the pound is expected to continue moving sideways along the support zone. In the second half of the week, increased activity, a reversal, and the start of a bullish price movement may occur. A brief penetration of the lower boundary of calculated support cannot be ruled out.
Potential Reversal Zones:
- Resistance: 1.3230–1.3280
- Support: 1.3020–1.2970
Recommendations:
- Buy: Can be used after confirmed reversal signals appear near the support zone.
- Sell: Risky due to low potential; may result in losses.
AUD/USD
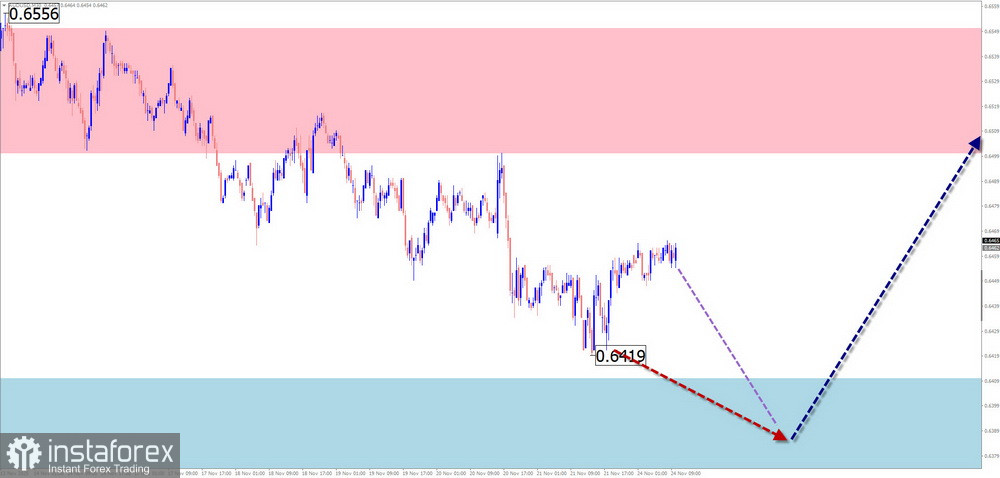
Brief Analysis: The AUD/USD main pair continues the downward movement that started at the end of September. On a larger scale, this section completes a bearish stretched flat. The wave structure is not yet complete. Prices are within a potential reversal zone.
Weekly Forecast: Sideways drifting with a downward vector is most likely in the next couple of days. A reversal and the start of a price increase may occur near the support zone. Peak activity is expected in the second half of the week.
Potential Reversal Zones:
- Resistance: 0.6500–0.6550
- Support: 0.6410–0.6360
Recommendations:
- Buy: Relevant after signals appear near support.
- Sell: Possible in fractional volumes during sessions.
USD/CHF
Brief Analysis: At the end of the bearish trend for the USD/CHF major pair since April, an upward wave forming a shifting plane is observed. Its potential does not exceed the correction level. The middle part (B) of the wave is near completion. No signals of an imminent reversal are present. Prices move along the upper boundary of a large potential reversal zone.
Weekly Forecast: A sideways movement with a downward vector is expected over the next day or two. Then, near calculated support, sideways fluctuations may create conditions for a reversal. Price growth is likely by the end of the week. Calculated resistance will limit the weekly range.
Potential Reversal Zones:
- Resistance: 0.8210–0.8260
- Support: 0.8020–0.7970
Recommendations:
- Buy: After confirmed reversal signals appear near support.
- Sell: Low potential; may result in losses.
EUR/JPY
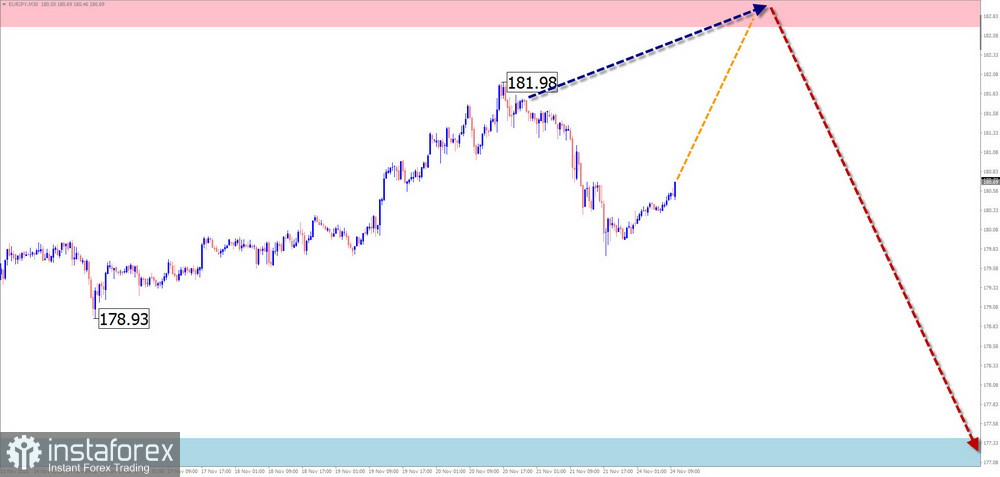
Brief Analysis: Since the end of February, EUR/JPY has been following a downward wave. Its structure includes a corrective part forming a shifting plane. The final segment (C) is missing. Prices bounced off a major timeframe resistance level.
Weekly Forecast: Sideways movement is expected at the start of the week. An upward vector may appear, but price retracement will not exceed resistance boundaries. A change in direction is expected by the end of the week. Calculated support defines the lower boundary of the expected weekly movement.
Potential Reversal Zones:
- Resistance: 181.70–182.20
- Support: 177.40–176.90
Recommendations:
- Sell: Small volumes during sessions, targeting the support zone.
- Buy: Only after confirmed reversal signals appear near support.
AUD/JPY
Analysis: Since April, the AUD/JPY main pair has been moving in a downward wave. Since October 9, the price has been correcting. The movement is flat, with extremes forming a stretched plane. The middle part (B) is near completion.
Weekly Forecast: Price growth is likely in the next couple of days. Near calculated resistance, sideways drifting is expected, forming conditions for a reversal. The beginning of a downward movement is likely at the end of this week or next. Calculated zones define the expected weekly range.
Potential Reversal Zones:
- Resistance: 102.30–102.80
- Support: 99.50–99.00
Recommendations:
- Buy: Low potential; suitable for fractional volumes in individual sessions.
- Sell: Relevant after reversal signals appear near resistance.
EUR/CHF
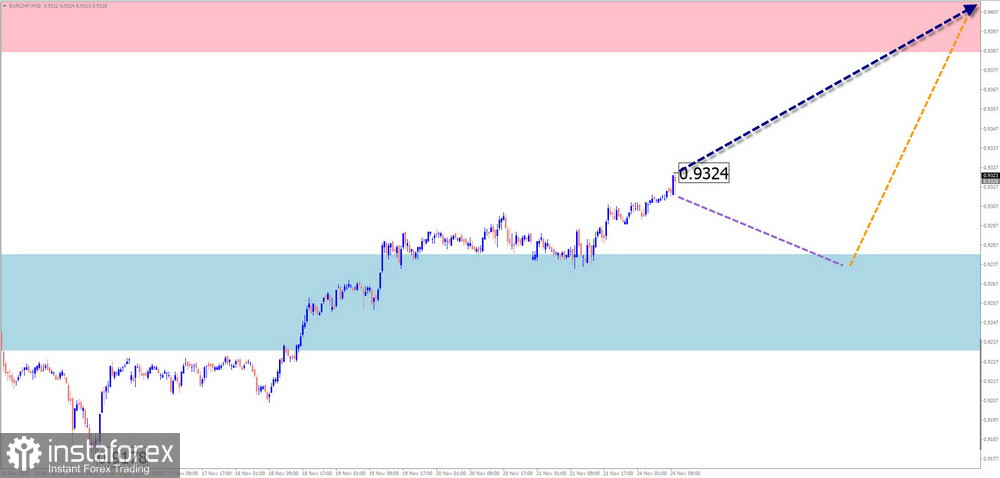
Brief Analysis: Since March, EUR/CHF short-term movements follow a downward wave. Over the past six months, the price has been correcting, moving mainly sideways. Extremes form a "stretched triangle." The upward movement from November 14 has reversal potential.
Weekly Forecast: A continuation of the overall upward movement is expected. Small declines or pressure on the lower support boundary are possible early in the week. A return to a bullish trend is likely closer to the weekend. Calculated zones define the expected weekly range.
Potential Reversal Zones:
- Resistance: 0.9390–0.9440
- Support: 0.9280–0.9290
Recommendations:
- Buy: Can be the main trading direction after confirmed reversal signals near support appear.
- Sell: Risky; may result in losses.
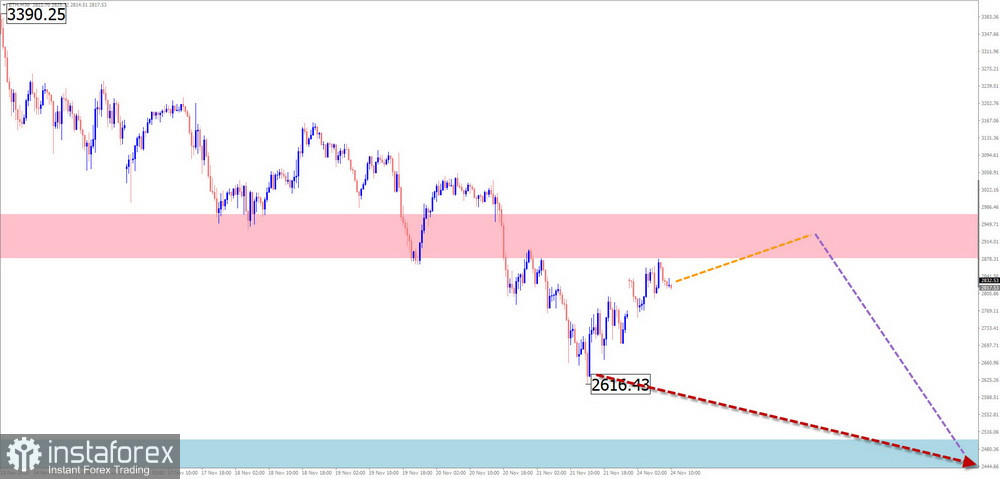
#Ethereum
Analysis: The upward wave of Ethereum from April 9 defines the main direction of the instrument. Since mid-August, a correction has been developing. The final part (C) is not complete.
Weekly Forecast: Sideways movement is expected in the next couple of days. A retracement to calculated resistance zones is possible. A trend change is likely afterward, with the second half of the week potentially more dynamic. A price decline toward support boundaries is possible.
Potential Reversal Zones:
- Resistance: 2880.0–2930.0
- Support: 2500.0–2450.0
Recommendations:
- Sell: Limited potential; suitable for fractional volumes during individual sessions.
- Buy: Only after confirmed reversal signals appear near support.
Notes: In simplified wave analysis (SWA), all waves consist of 3 parts (A-B-C). At each timeframe, the last incomplete wave is analyzed. Expected movements are shown with dotted lines.
Attention: The wave algorithm does not account for the duration of price movements over time.