Friday's Trade Review:
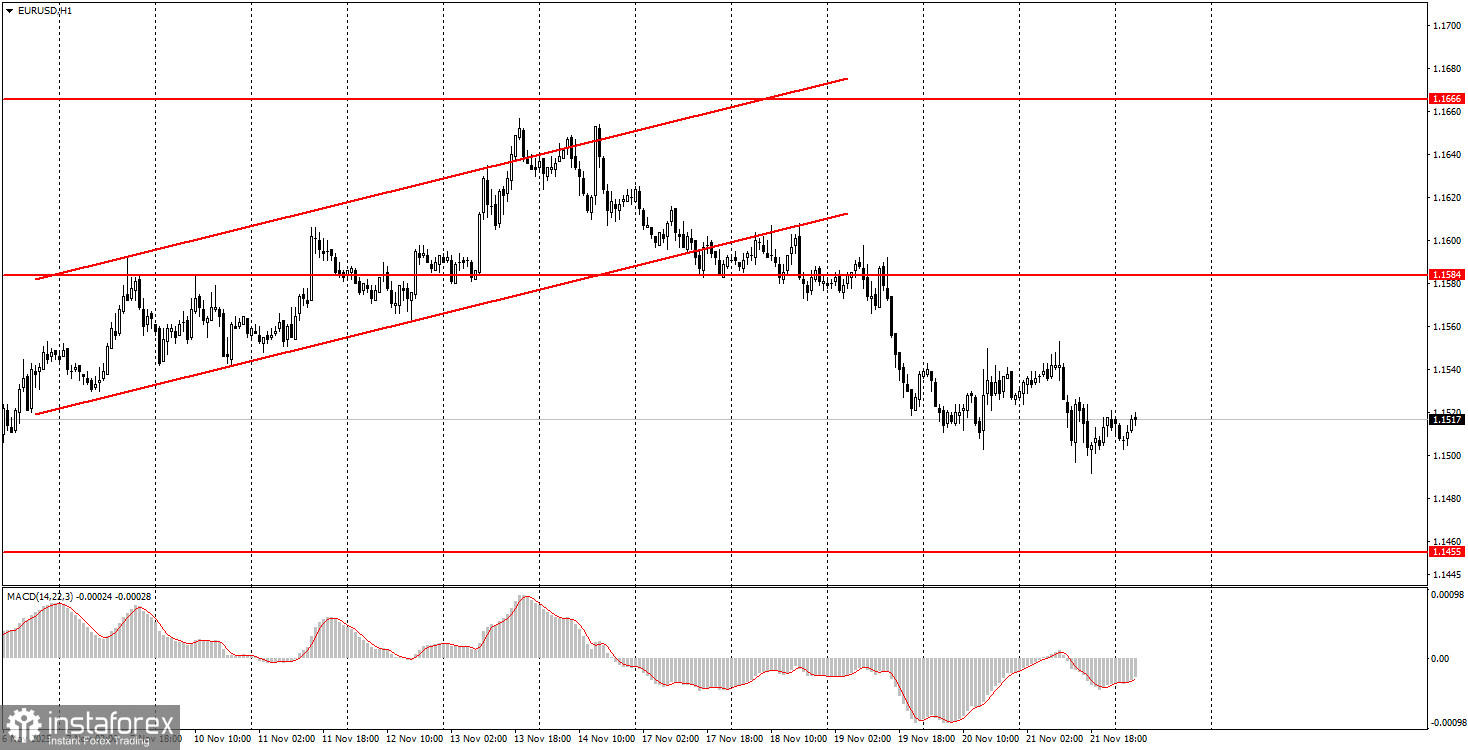
1H Chart of the EUR/USD Pair

The EUR/USD currency pair traded lower again on the last trading day of the past week. Were there reasons for this? A fair number of macroeconomic reports were published on Friday, but virtually all of them contradicted each other. In the Eurozone, two business activity indices showed opposite dynamics, while in the U.S., the business activity indices also displayed contradictory results. The U.S. consumer sentiment index was weaker than expected (which did not support dollar growth), and both business activity indices in Germany fell sharply. These factors likely contributed to the decline of the European currency in the first half of the day. Overall, the dollar is rising again, having risen for over a week amid strengthening "dovish" market expectations for the Federal Reserve's last meeting and rising U.S. unemployment. The flat trend on the daily timeframe continues, so theoretically, the pair could drop to 1.1400, above which the flat remains intact. However, we still expect growth to at least the 1.1800 level within the same sideways channel.
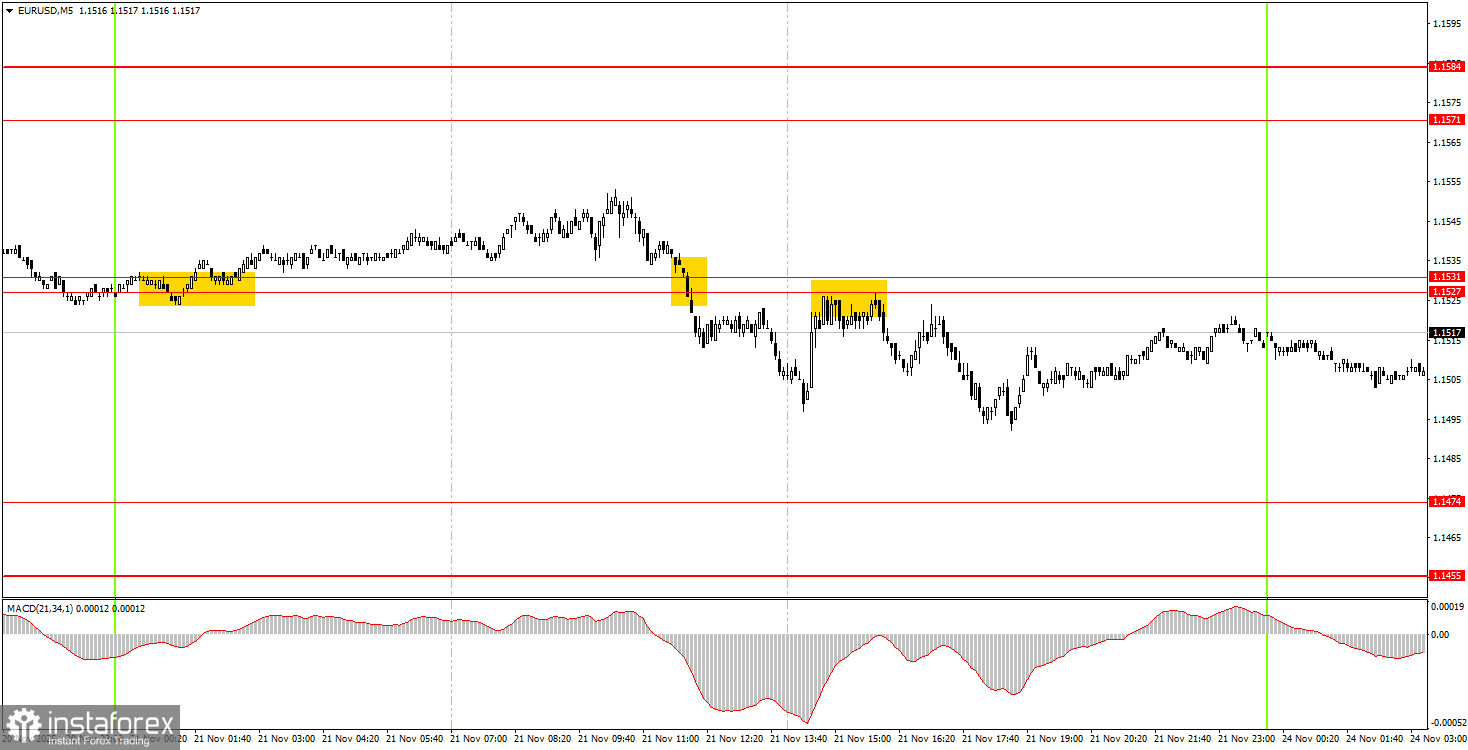
5M Chart of the EUR/USD Pair
On the 5-minute timeframe, two trading signals were generated on Friday. A sell signal was formed during the European trading session in the 1.1527-1.1531 area, and another similar signal occurred during the American trading session. In both cases, the pair descended by 15-20 pips. There was also a nighttime buy signal, but it also did not yield high profits. Market movements remain weak, which is the main issue.
How to Trade on Monday:
On the hourly timeframe, the EUR/USD pair is declining again and may be forming a new downward trend. The overall fundamental and macroeconomic background remains very weak for the U.S. dollar; thus, the European currency can still decline only on technical grounds—the flat on the daily timeframe remains relevant. However, we anticipate an end to this flat and a resumption of the upward trend in 2025, with upward movements also occurring within the flat.
On Monday, novice traders can trade from the 1.1527-1.1531 area again. A price consolidation above this area will allow for long positions targeting 1.1571. A price bounce from this area makes short positions valid, targeting 1.1474.
On the 5-minute timeframe, the following levels should be considered: 1.1354-1.1363, 1.1413, 1.1455-1.1474, 1.1527-1.1531, 1.1571-1.1584, 1.1655-1.1666, 1.1745-1.1754, 1.1808, 1.1851, 1.1908, and 1.1970-1.1988. On Monday, European Central Bank President Christine Lagarde is scheduled to speak, as well as the business climate index from the Ifo Institute in Germany. We consider both of these events to be secondary. Volatility is likely to remain low today as well.
Key Principles of My Trading System:
- The strength of the signal is considered based on the time taken to form the signal (bounce or breach of a level). The less time taken, the stronger the signal.
- If two or more trades have been opened around a certain level based on false signals, all subsequent signals from that level should be ignored.
- In a flat market, any pair can create numerous false signals or may not form them at all. In any case, it's best to stop trading at the first signs of a flat.
- Trading deals are opened during the period between the start of the European session and the middle of the American session, after which all deals should be closed manually.
- On the hourly timeframe, it is preferable to trade based on signals from the MACD indicator only when there is good volatility and a trend that is confirmed by a trend line or trend channel.
- If two levels are too close to each other (between 5 and 20 pips), they should be treated as an area of support or resistance.
- After a 15-pip move in the right direction, a Stop Loss should be set to breakeven.
What the Charts Show:
- Support and resistance price levels are targets for opening buy or sell positions. Take Profit levels can be placed around them.
- Red lines indicate trend channels or trend lines, reflecting the current trend and indicating the preferred trading direction.
- The MACD indicator (14,22,3) — histogram and signal line — is a supplementary indicator that can also be used as a source of signals.
Important announcements and reports (always available in the news calendar) can significantly impact the movement of the currency pair. Therefore, during their release, it is recommended to trade with maximum caution or to exit the market to avoid sharp reversals against the preceding movement.
Beginners trading on the Forex market should remember that not every trade can be profitable. Developing a clear strategy and money management is key to long-term success in trading.