Trade Analysis for Monday:
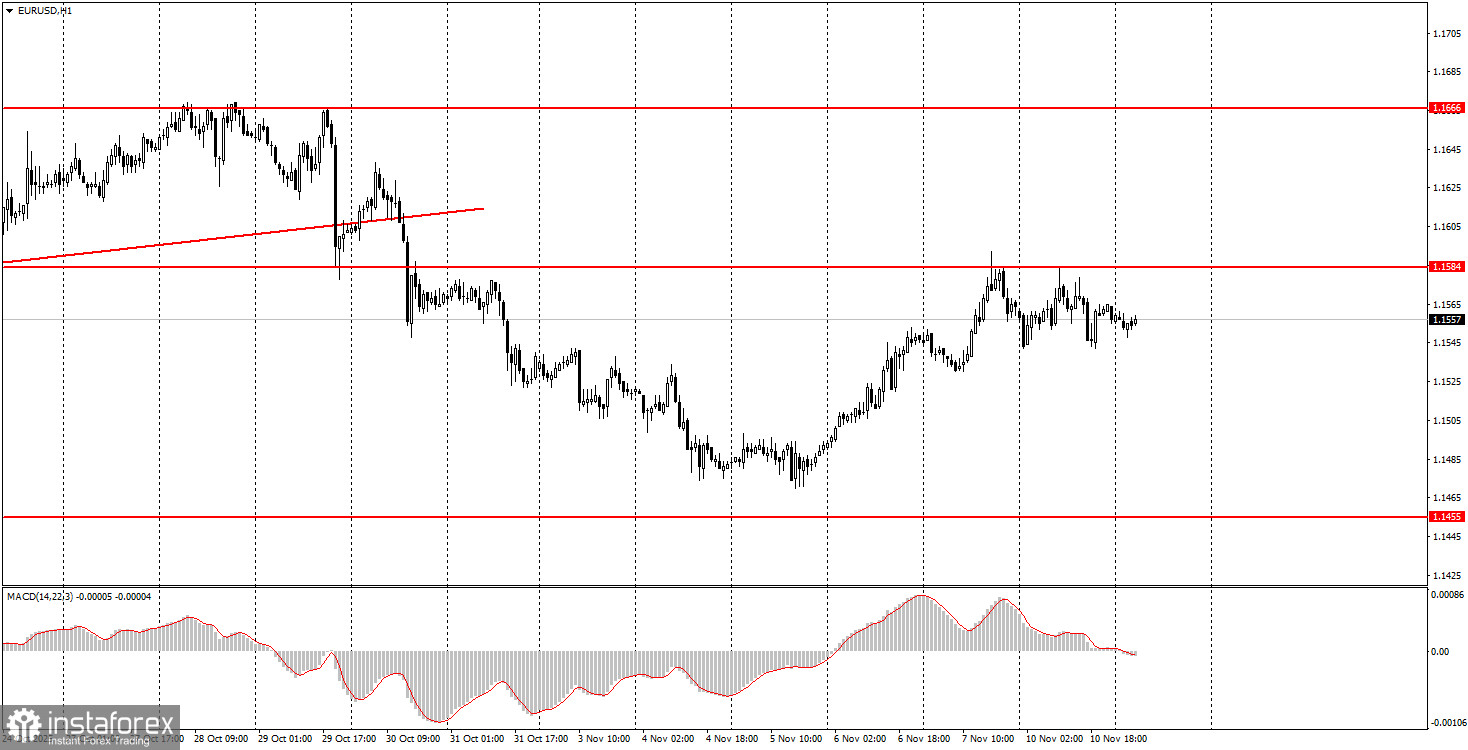
1H Chart of the EUR/USD Pair
The EUR/USD currency pair traded mostly sideways on Monday and failed to break past the important level of 1.1584. In principle, not much was expected from Monday. The macroeconomic background was completely absent in all the countries of interest, and Donald Trump's morning promises to soon end the "shutdown" did not catch anyone's interest. The market did not experience euphoria over the conclusion of the "shutdown," just as it had ignored the "shutdown" for a month and a half. Recall that over the past month and a half, the U.S. currency had been rising moderately, which contradicted the fundamental backdrop. Therefore, we believe that expecting the dollar to grow following the conclusion of the "shutdown" is as illogical as expecting it to grow during the "shutdown." Considering the broader context, the dollar should already be above 1.2000, as the situation in the U.S. has not improved. Nevertheless, the flat condition on the daily timeframe continues, so we may continue to observe chaotic movements within it for the foreseeable future.
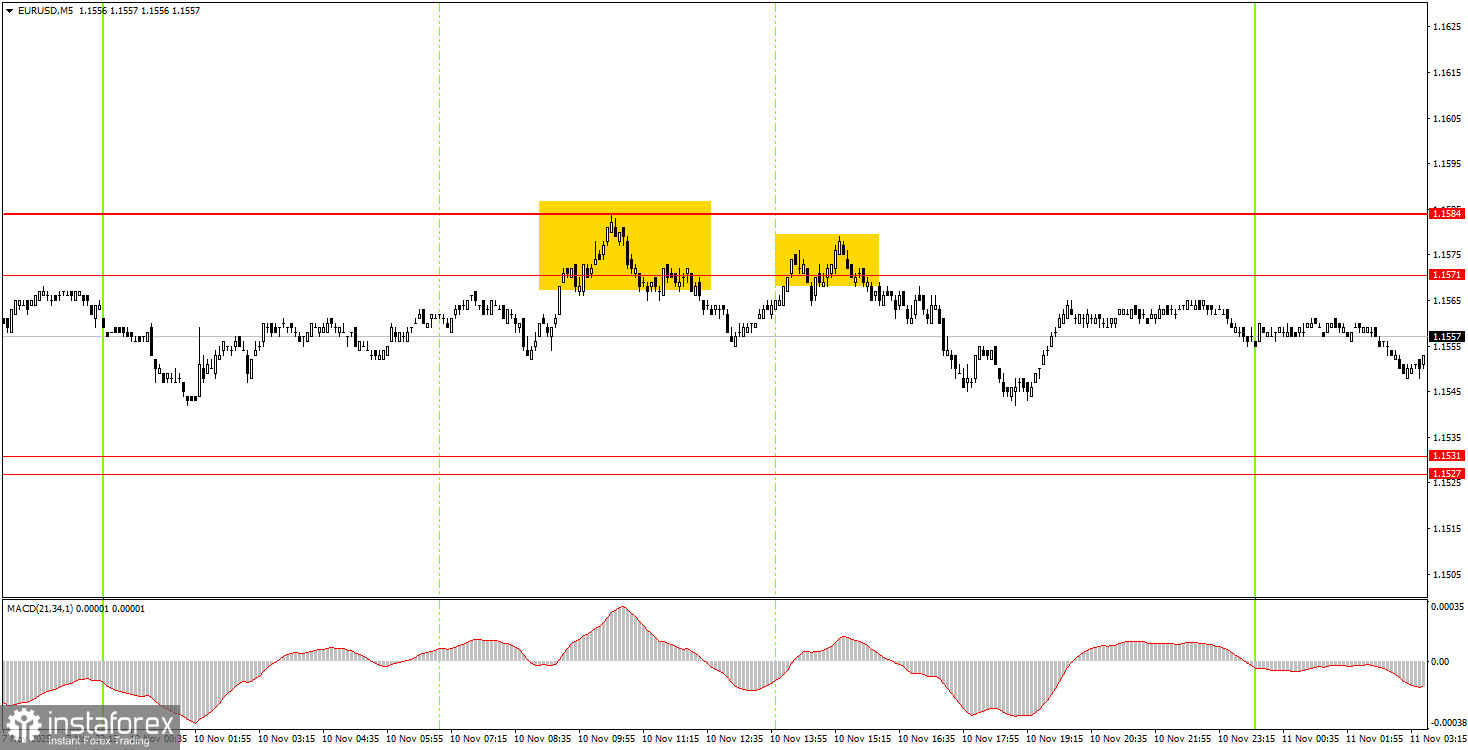
5M Chart of the EUR/USD Pair
On the 5-minute timeframe, two trading signals were generated on Monday. The price bounced twice within the 1.1571-1.1584 range, allowing novice traders to open short positions. Given the day's overall volatility of approximately 40 pips, high profits were not realistically expected. However, around 20 pips could have been earned from these signals. Today, new signals are expected to form.
How to Trade on Tuesday:
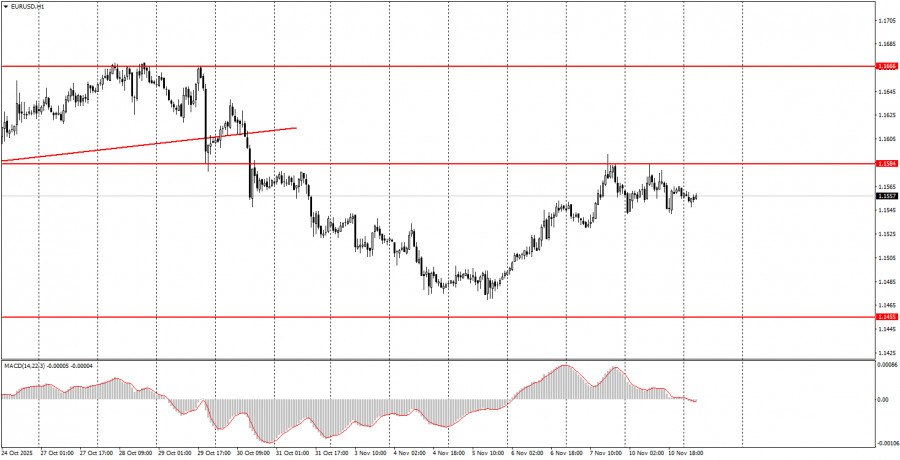
On the hourly timeframe, the EUR/USD pair is still maintaining a downward trend, but this could end soon. The overall fundamental and macroeconomic backdrop remains very weak for the U.S. dollar. Therefore, based solely on technical grounds, the euro may continue to decline – the flat condition on the daily timeframe remains relevant. However, we anticipate its conclusion and a resumption of the upward trend in 2025.
On Tuesday, novice traders can again trade from the ranges of 1.1527-1.1531 and 1.1571-1.1584, as the price continues to stay between them. Today's macroeconomic background will be weak, so volatility could remain low.
On the 5-minute timeframe, levels to consider are 1.1354-1.1363, 1.1413, 1.1455-1.1474, 1.1527-1.1531, 1.1571-1.1584, 1.1655-1.1666, 1.1745-1.1754, 1.1808, 1.1851, 1.1908, and 1.1970-1.1988. No important events or reports are scheduled in the U.S. for Monday, while in the Eurozone, European Central Bank President Christine Lagarde will give another speech, and the ZEW Economic Sentiment Indexes will be published. These events may only provoke a very minor market reaction.
Key Principles of My Trading System:
- The strength of the signal is considered based on the time taken to form the signal (bounce or breach of a level). The less time taken, the stronger the signal.
- If two or more trades have been opened around a certain level based on false signals, all subsequent signals from that level should be ignored.
- In a flat market, any pair can create numerous false signals or may not form them at all. In any case, it's best to stop trading at the first signs of a flat.
- Trading deals are opened during the period between the start of the European session and the middle of the American session, after which all deals should be closed manually.
- On the hourly timeframe, it is preferable to trade based on signals from the MACD indicator only when there is good volatility and a trend that is confirmed by a trend line or trend channel.
- If two levels are too close to each other (between 5 and 20 pips), they should be treated as an area of support or resistance.
- After a 15-pip move in the right direction, a Stop Loss should be set to breakeven.
What the Charts Show:
- Support and resistance price levels are targets for opening buy or sell positions. Take Profit levels can be placed around them.
- Red lines indicate trend channels or trend lines, reflecting the current trend and indicating the preferred trading direction.
- The MACD indicator (14,22,3) — histogram and signal line — is a supplementary indicator that can also be used as a source of signals.
Important announcements and reports (always available in the news calendar) can significantly impact the movement of the currency pair. Therefore, during their release, it is recommended to trade with maximum caution or to exit the market to avoid sharp reversals against the preceding movement.
Beginners trading on the Forex market should remember that not every trade can be profitable. Developing a clear strategy and money management is key to long-term success in trading.