Friday's Trade Analysis:
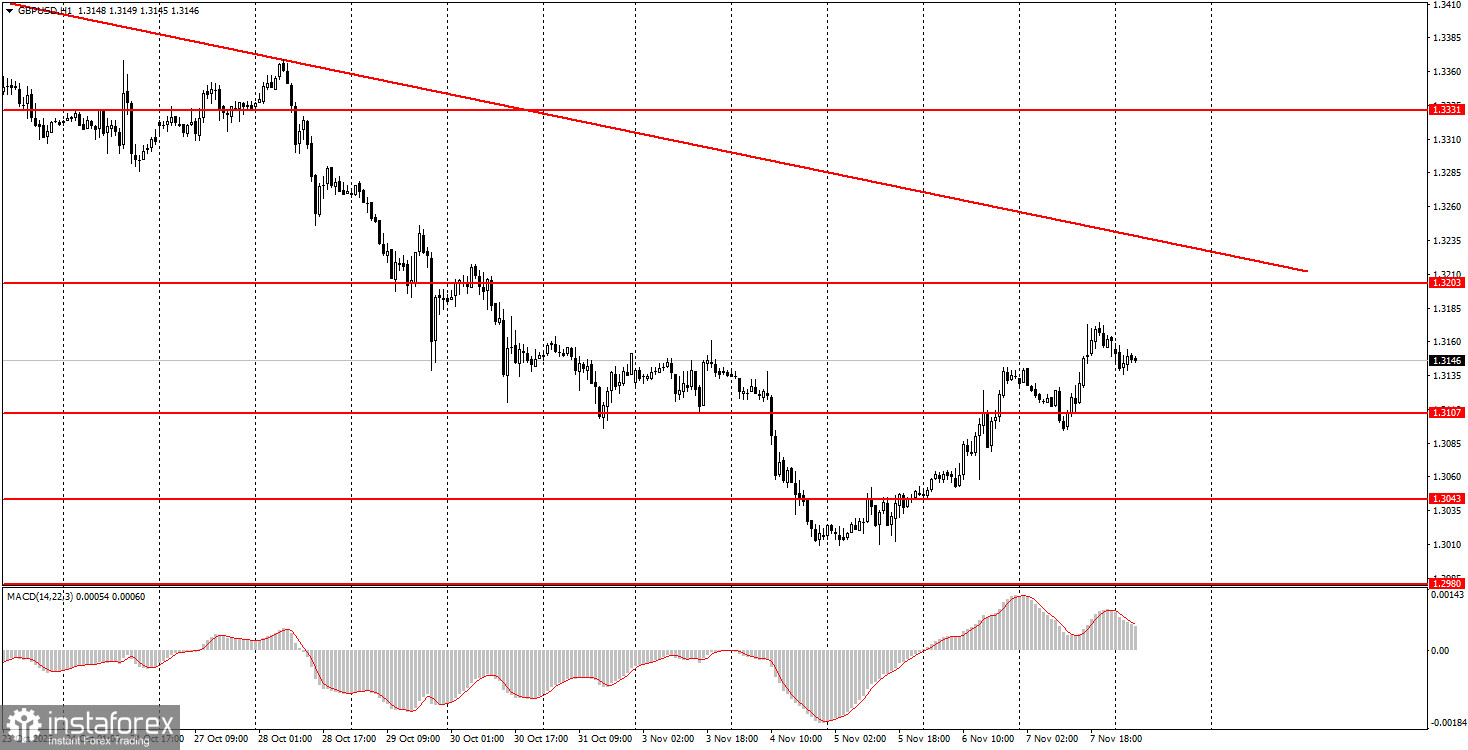
1-Hour Chart of GBP/USD
The GBP/USD pair also traded higher on Friday, but the British currency is under a clear descending trend line, so it is still too early to discuss the end of this downward trend. It should be noted that the pound sterling, like the euro, has been declining for a month and a half. Fairly speaking, the pound has had occasional factors contributing to its decline (unlike the euro), but the pound has depreciated much more than the European currency. Overall, the global fundamental backdrop remains significantly unfavorable for the U.S. dollar. Thus, it is also not possible to explain the one-and-a-half-month decline of the pound based on specific events. The only report released on Friday was the University of Michigan consumer sentiment index, which, of course, came in below expectations. As a result, the dollar fell, as might be expected; however, the dollar's decline lasted almost the entire day and was nearly halted immediately after the report was published. We continue to believe the pair is currently moving to a much greater extent on technical factors, while the fundamental backdrop remains ignored by the market.
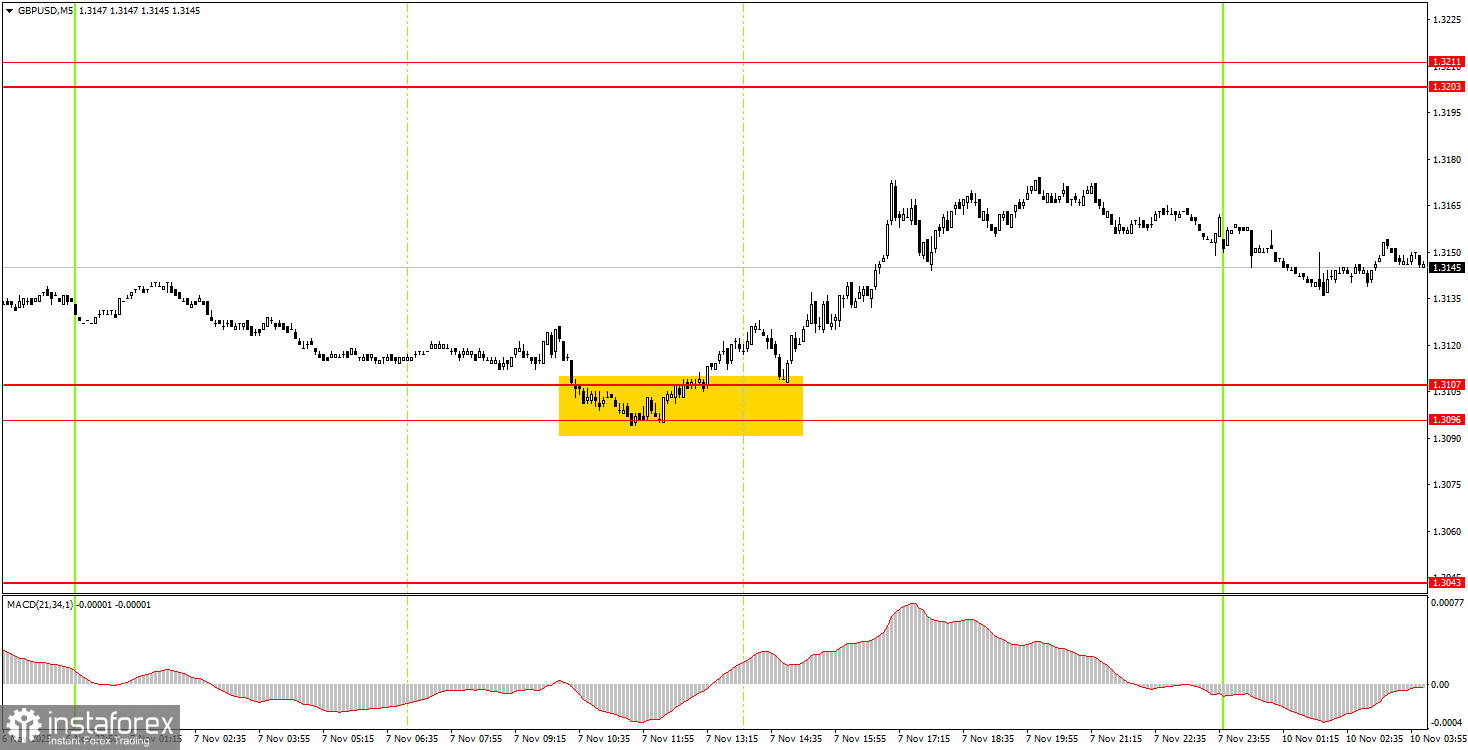
5-Minute Chart of GBP/USD
On the 5-minute timeframe, a decent buy signal formed on Friday around 1.3096-1.3107. Subsequently, the price moved up about 40 pips, which novice traders could have easily and straightforwardly capitalized on.
How to Trade on Monday:
On the hourly timeframe, the GBP/USD pair continues to develop a new downward trend, and the pound sterling has been declining for completely any reasons over the last month and a half. As we have mentioned, there are no global reasons for a prolonged rise in the dollar; therefore, in the medium term, we expect movement only to the upside. However, the flat factor in the long term continues to pull the pair down —an absolutely illogical development from a macroeconomic and fundamental perspective.
On Monday, novice traders can remain in long positions after the breakout of the area at 1.3096-1.3107, with a target of 1.3203 and a Stop Loss set to breakeven. For new trading signals, we will need to work through the areas of 1.3096-1.3107 or 1.3203-1.3211.
On the 5-minute timeframe, traders can currently operate at 1.2913, 1.2980-1.2993, 1.3043, 1.3096-1.3107, 1.3203-1.3211, 1.3259, 1.3329-1.3331, 1.3413-1.3421, 1.3466-1.3475, 1.3529-1.3543, and 1.3574-1.3590. There are no important events scheduled in the UK or the U.S. for Monday, so the movements throughout the day may be sluggish. A new rise in the British currency will somewhat confirm that the illogical growth of the dollar is nearing its end.
Key Principles of My Trading System:
- The strength of the signal is considered based on the time taken to form the signal (bounce or breach of a level). The less time taken, the stronger the signal.
- If two or more trades have been opened around a certain level based on false signals, all subsequent signals from that level should be ignored.
- In a flat market, any pair can create numerous false signals or may not form them at all. In any case, it's best to stop trading at the first signs of a flat.
- Trading deals are opened during the period between the start of the European session and the middle of the American session, after which all deals should be closed manually.
- On the hourly timeframe, it is preferable to trade based on signals from the MACD indicator only when there is good volatility and a trend that is confirmed by a trend line or trend channel.
- If two levels are too close to each other (between 5 and 20 pips), they should be treated as an area of support or resistance.
- After a 20-pip move in the right direction, a Stop Loss should be set to breakeven.
What the Charts Show:
- Support and resistance price levels are targets for opening buy or sell positions. Take Profit levels can be placed around them.
- Red lines indicate trend channels or trend lines, reflecting the current trend and indicating the preferred trading direction.
- The MACD indicator (14,22,3) — histogram and signal line — is a supplementary indicator that can also be used as a source of signals.
Important announcements and reports (always available in the news calendar) can significantly impact the movement of the currency pair. Therefore, during their release, it is recommended to trade with maximum caution or to exit the market to avoid sharp reversals against the preceding movement.
Beginners trading on the Forex market should remember that not every trade can be profitable. Developing a clear strategy and money management is key to long-term success in trading.