The EUR/USD currency pair continued its downward movement on Monday, with no sign of a respite. However, we've been stating for over a month that the current decline in the EUR/USD pair is entirely illogical and can only be driven by technical factors on higher timeframes. On the weekly timeframe, the price has bounced off a long-term descending trend line, while on the daily timeframe it continues to show flat movement, with the price declining.
The market continues to ignore a vast number of factors that are pressuring the US dollar. One of these factors is the "shutdown," which has recently been somewhat overlooked. To be precise, it has not been "forgotten," but rather "normalized." "Shutdowns" have become a common occurrence under Trump, as the President of the United States negotiates only through threats and ultimatums. With many countries lacking the economic and military power of the US, Washington under Trump imposes its terms of cooperation. Many agree to this. However, Trump has no leverage against the Democrats or the Federal Reserve. Therefore, on the home front, Trump is experiencing defeat after defeat.
Turning back to the "shutdown," today marks the 35th day of the suspension of government operations and all state structures. The US Senate has already convened 13 times to vote on next year's budget, and each time has been unsuccessful. Some might think that the Democrats and Republicans made 13 attempts to reach an agreement. However, they merely gathered 13 times to re-vote. No one is willing to make concessions. The Democrats have no reason to yield to their principled adversary, who has antagonized them throughout 2025. Republicans are standing firm and refuse to back down from Trump's position.
Experts estimate that each week the American economy is "stalled" costs it 0.01% to 0.03% of GDP on a quarterly basis. So, having passed four weeks, we will wait for the fifth and sixth weeks, and a new record for the length of a "shutdown" (the previous record was exactly 35 days) will be set, followed by Trump's fiery speeches blaming the Democrats for the slowing growth of the US GDP. It still appears that Trump is running not a country, but his own bank. There's no guarantee that such a management strategy would be successful, but if it were Trump's bank, he would have every right to promote any of his decisions, regardless of their consequences.
Here, we are discussing an entire country with hundreds of millions of people who are caught in this situation. Thus, the "shutdown" is highly detrimental to the US economy. And since it is detrimental to the economy, it is also detrimental to the dollar. Therefore, we still believe that the fundamental and macroeconomic background supposedly explaining the strengthening of the dollar is merely an attempt to present wishful thinking as reality.
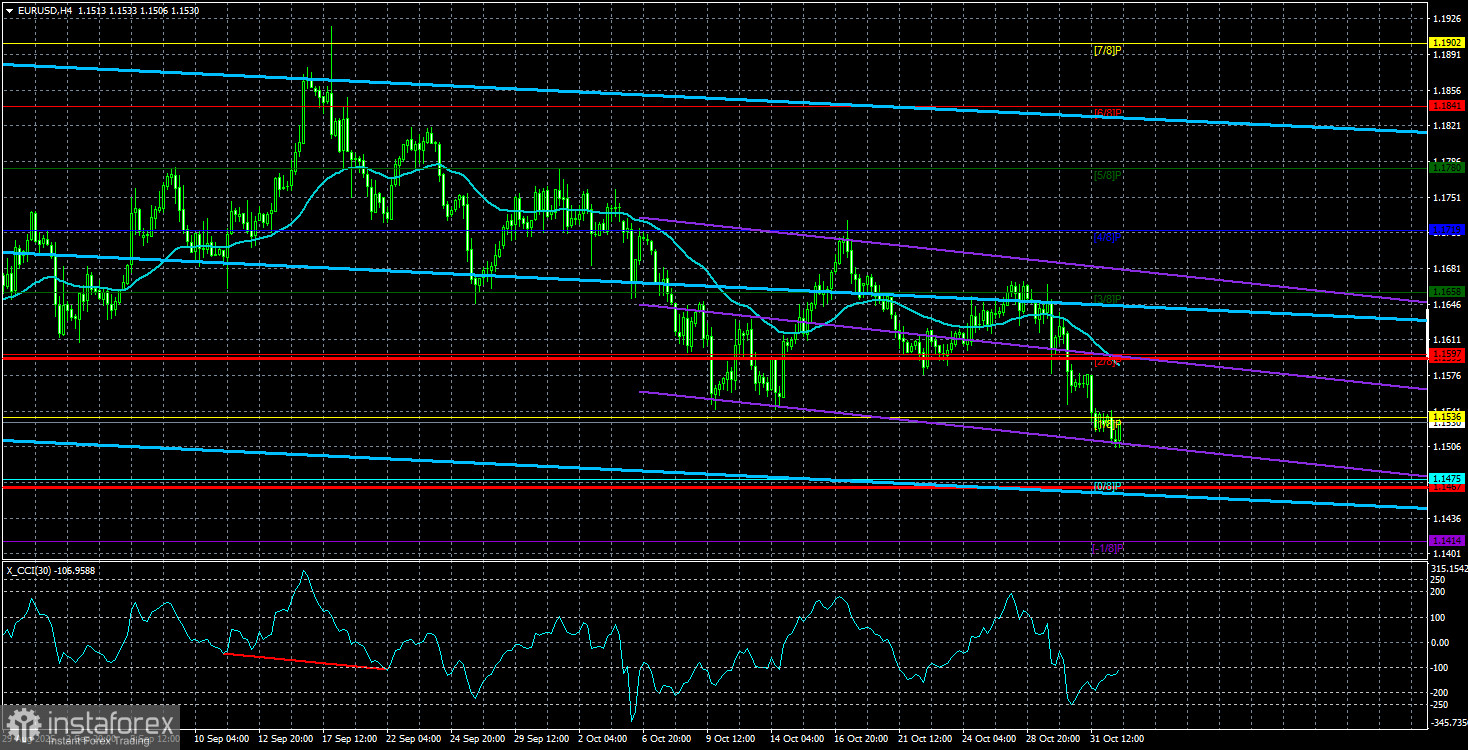
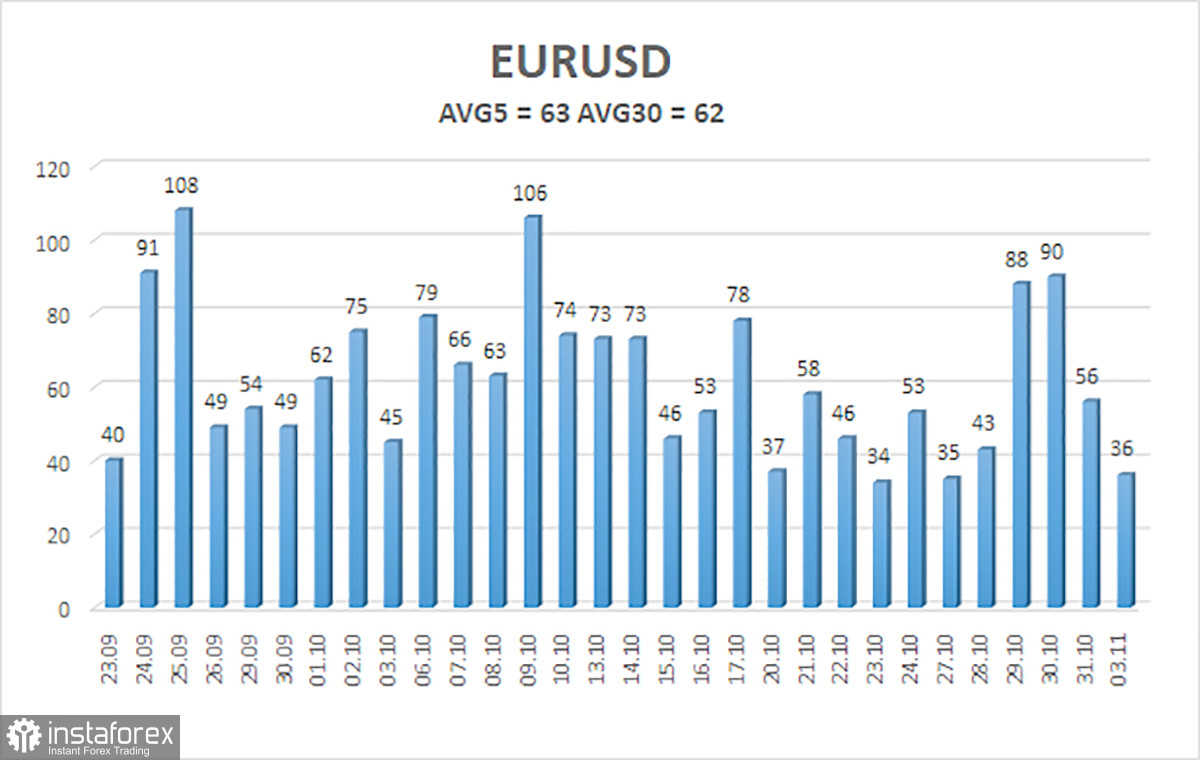
The average volatility of the EUR/USD currency pair over the last five trading days, as of November 4, stands at 63 pips, which is considered "average." We expect the pair to trade between 1.1467 and 1.1593 on Tuesday. The upper channel of linear regression is oriented sideways, signaling a flat trend. The CCI indicator entered the oversold area twice in October, which may provoke a new wave of upward trends.
Nearest Support Levels:
- S1 – 1.1475
- S2 – 1.1414
- S3 – 1.1353
Nearest Resistance Levels:
- R1 – 1.1536
- R2 – 1.1597
- R3 – 1.1658
Trading Recommendations:
On Tuesday, traders can expect the decline to continue and may trade from the 1.3115 level, where the price has bounced three times already. Short positions will become relevant upon stabilization below 1.3115, targeting 1.3050, although low volatility may also be observed today.
Explanations for the Illustrations:
- Support and resistance levels are indicated by thick red lines, near which movement may end. They are not sources of trading signals.
- Kijun-sen and Senkou Span B lines are Ichimoku indicator lines transferred from the 4-hour timeframe to the hourly timeframe. They are strong indicators.
- Extremum levels are marked by thin red lines where the price previously bounced. They are sources of trading signals.
- Yellow lines indicate trend lines, trend channels, and any other technical patterns.
- Indicator 1 on the COT charts shows the size of the net position for each category of traders.