Trade Analysis for Tuesday:
1H Chart of the GBP/USD Pair
The GBP/USD pair unexpectedly plunged on Tuesday, like a stone. The UK and U.S. calendars were empty yesterday, so the sharp decline of the British currency mystified many. The situation became clearer in the second half of the day, when it was revealed that UK Treasury Secretary Rachel Reeves expressed her opinion on Brexit. According to her, leaving the EU was a mistake (though she hinted at it), and the government is currently working to strengthen and restore ties with the European Union and many other countries around the world. In our view, this is a relatively weak reason to sell the pound, but in recent weeks, the pound has been falling at any pretext, while the market continues to ignore the objective global fundamental backdrop, which still indicates extreme weakness for the American currency and its lack of prospects. The flat on the daily timeframe continues, so do not be surprised by illogical movements.
5M Chart of the GBP/USD Pair
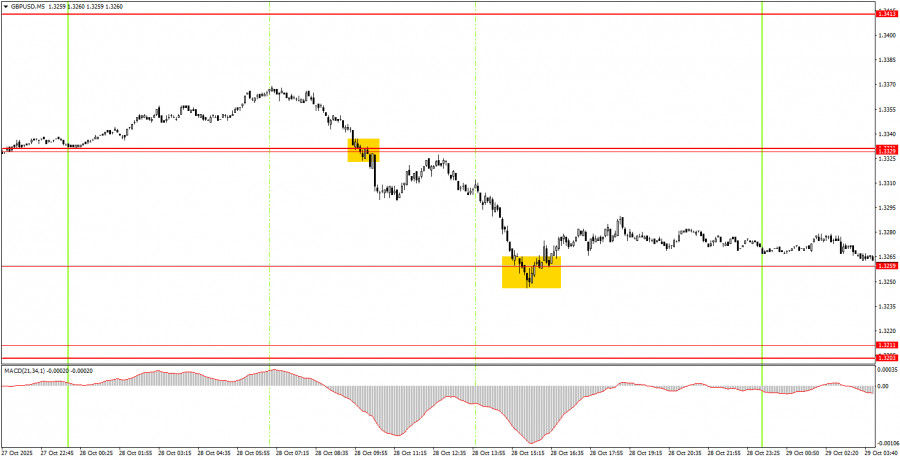
On the 5-minute timeframe, two decent trading signals were formed on Tuesday. Initially, the pair broke through the 1.3329-1.3331 area, allowing novice traders to open short positions. Shortly after, the level of 1.3259 was established, from which the price rebounded. Thus, the first trade could have yielded around 45 pips, while the second trade resulted in neither profit nor loss as movements ceased at that moment.
How to Trade on Wednesday:
On the hourly timeframe, the GBP/USD pair began forming a new upward trend but quickly ended it. At the moment, the British pound is again declining for absolutely any reasons. As mentioned earlier, there are no grounds for a prolonged rise of the dollar, so in the medium term, we expect movement only to the north. However, the flat factor continues to pull the pair down in the long term, which is an utterly illogical development.
On Wednesday, the GBP/USD pair continues its downward movement, although this evening the FOMC meeting will take place, at which the regulator is expected to cut the key rate. Therefore, breaching the 1.3259 level will allow new short positions with targets at 1.3203-1.3211. If the price holds above 1.3259, then long positions may be considered with targets at 1.3329-1.3331.
On the 5-minute timeframe, current trading levels include 1.3102-1.3107, 1.3203-1.3211, 1.3259, 1.3329-1.3331, 1.3413-1.3421, 1.3466-1.3475, 1.3529-1.3543, 1.3574-1.3590, 1.3643-1.3652, 1.3682, and 1.3763. On Wednesday, there are no significant reports or events scheduled in the UK; however, in the U.S., the results of the FOMC meeting will be announced this evening, which is a significant event, even given the known decision the central bank will make.
Basic Rules of the Trading System:
- The strength of a signal is determined by the time it takes to form the signal (bounce or breakout of a level). The less time it takes, the stronger the signal.
- If two or more trades based on false signals were opened around a specific level, all subsequent signals from that level should be ignored.
- In a flat market, any pair can generate numerous false signals or none at all. In any case, at the first signs of a flat, it is better to stop trading.
- Trades should be opened during the time period between the start of the European session and the middle of the American session, after which all trades should be closed manually.
- On the hourly timeframe, trading signals from the MACD indicator are ideally used only when there is good volatility and a trend confirmed by a trend line or trend channel.
- If two levels are too close together (5 to 20 pips apart), treat them as a support or resistance area.
- After a 20-pip move in the correct direction, a Stop Loss should be set to breakeven.
What's on the Charts:
- Price Support and Resistance Levels: Levels that serve as targets for opening buys or sells. Take Profit levels can be placed around them.
- Red Lines: Channels or trend lines that reflect the current trend and indicate the preferred direction for trading.
- MACD Indicator (14,22,3): The histogram and signal line – a supplementary indicator that can also be used as a source of signals.
Important speeches and reports (always found in the news calendar) can significantly impact the movement of the currency pair. Therefore, trading during their release should be done with utmost caution or exit the market to avoid sudden price reversals against the preceding movement.
Beginners trading in the Forex market should remember that not every trade can be profitable. Developing a clear strategy and effective money management are essential for success in trading over the long term.


