Trade Review for Tuesday:
1-Hour Chart of EUR/USD
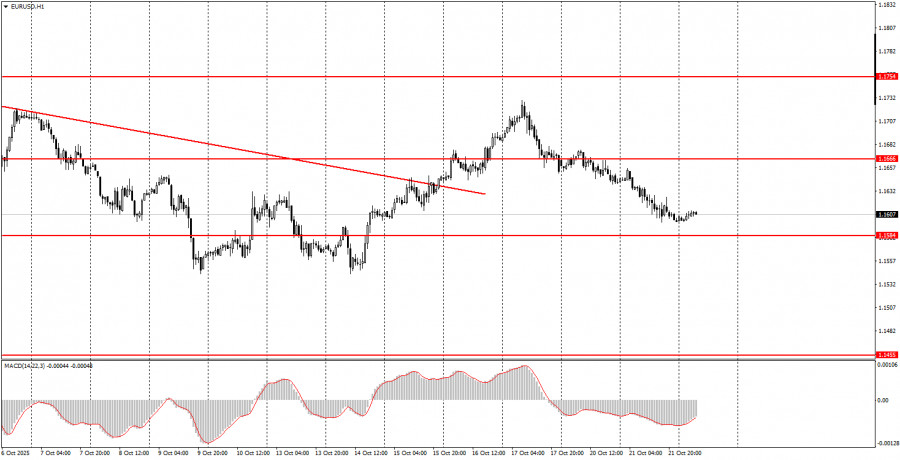
On Tuesday, the EUR/USD pair continued drifting lower slowly and with low volatility. The euro has now declined for three straight days, despite having no fundamental or technical justification. We continue to view nearly any current growth in the U.S. dollar as illogical. Traders should keep in mind the clearly visible range-bound structure on the daily timeframe, which may be the main reason behind the unusual and erratic price movements.
On both Monday and Tuesday, there were no noteworthy economic reports or events in either the Eurozone or the United States. As a result, traders had little to react to. The upward trend on the hourly chart remains in force after the recent breakout above another descending trendline. However, the pair continues falling despite the absence of a clear reason.
5-Minute Chart of EUR/USD
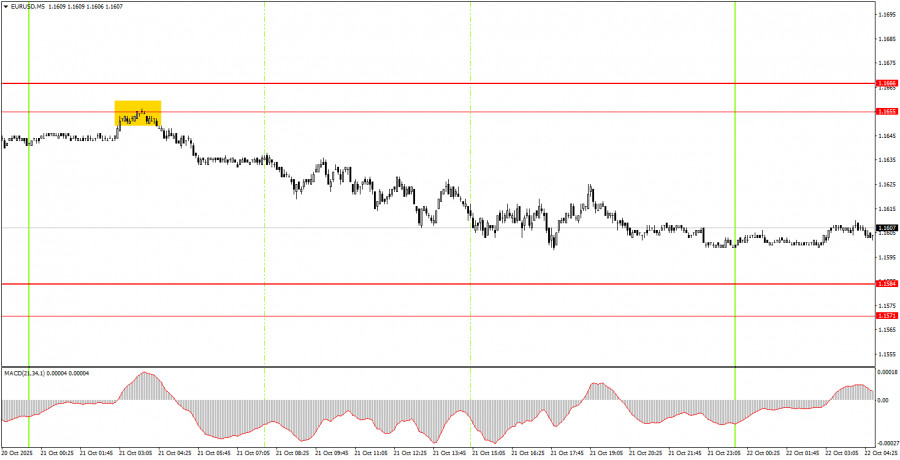
On the 5-minute timeframe, only one valid trading signal was generated throughout Tuesday, and it formed during the Asian session. The price perfectly bounced off the 1.1655 level, then proceeded to decline by 40 pips. Those traders who managed to act on this signal may have booked solid short-term gains, especially considering the limited daily volatility.
How to Trade on Wednesday:
On the hourly chart, EUR/USD is starting to exhibit signs of a resumed upward trend. The descending trendline has once again been broken, and the overall fundamental and macroeconomic backdrop remains unfavorable for the U.S. dollar. Therefore, we continue to anticipate further development of the 2025 bullish trend. However, traders should keep in mind that the broad sideways range on the daily timeframe continues to dictate price behavior. It is this very flat structure that leads to low volatility and irrational movements on lower timeframes.
On Wednesday, EUR/USD may move in any direction, once again due to the absence of fundamentals. The next trading signals are likely to emerge near the 1.1571–1.1584 area, where the price was located at the time of writing.
For intraday trading on the 5-minute chart, the following levels should be monitored: 1.1354–1.1363, 1.1413, 1.1455–1.1474, 1.1527, 1.1571–1.1584, 1.1655–1.1666, 1.1745–1.1754, 1.1808, 1.1851, 1.1908, 1.1970–1.1988. On Wednesday, European Central Bank President Christine Lagarde is scheduled to give another public speech, but market interest remains very low. Meanwhile, the U.S. economic calendar is empty.
Core Trading System Rules
- The strength of any signal is determined by how quickly it forms (breakout or rebound). The faster it forms, the stronger the signal.
- If two or more false trades have occurred near a level, all subsequent signals from that level should be ignored.
- During flat markets, any pair may generate many false signals—or fail to generate any at all. In these scenarios, it's better to suspend trading when the flat is confirmed.
- Trades should be executed between the beginning of the European session and the midpoint of the U.S. session. All open positions should be manually closed afterward.
- On the 1-hour chart, MACD-based trades should only be executed when good volatility and a clear trend are present, preferably confirmed by a visible trendline or channel.
- If two levels are located too close together (5–20 pips), treat them as a support/resistance area rather than individual levels.
- Once a trade moves 15 pips in your favor, the Stop Loss should be moved to breakeven to protect capital.
What's on the Chart?
- Support and resistance levels represent key price zones, often suitable for placing Take Profit orders.
- Red lines indicate trendlines or trend channels and denote the current market direction.
- The MACD (14,22,3) indicator and its histogram/signal line serve as a useful tool for confirming entries.
- Murray levels can help estimate the range or limits of trend and correction phases.
- Volatility levels (red horizontal lines) define the probable price range based on recent price action.
- The CCI indicator provides reversal signals when entering overbought (above +250) or oversold (below -250) zones.
Important Note for Beginners
Trading during major news events (as listed on the calendar) can significantly impact price movement. During such times, trade cautiously or step out of the market entirely to avoid a sharp reversal against your position.
Beginners must remember that not every trade can be profitable. The key to long-term success in forex is maintaining a consistent strategy, reinforcing discipline, controlling risk, and following sound money management principles.


