Thursday Trade Review:
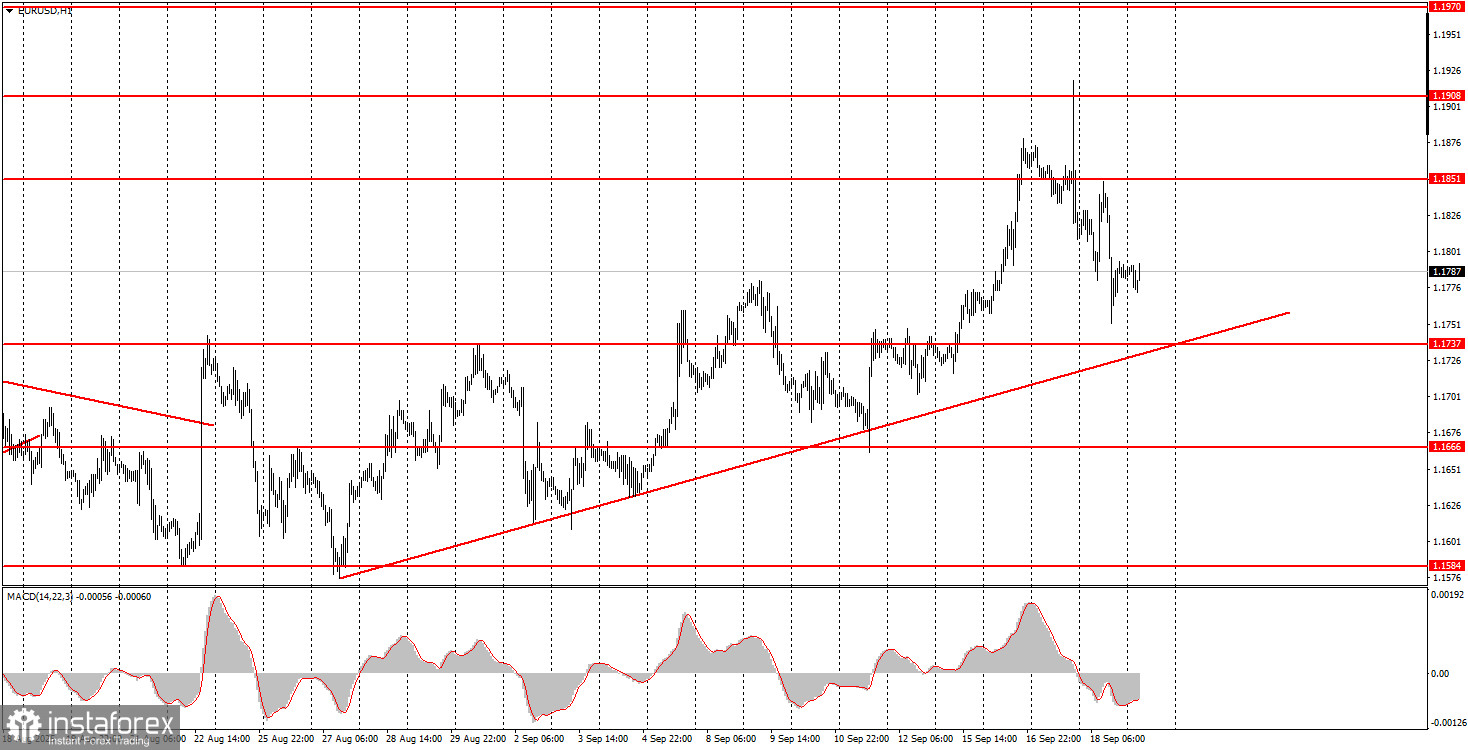
1H Chart of EUR/USD
On Thursday, the EUR/USD pair continued its downward movement after Wednesday evening, though we consider this move to lack logic. If you think about it, there was not a single reason for the euro to fall on Thursday, nor for the dollar to rise. However, the Bank of England's meeting triggered a drop in the pound sterling, which, in turn, pulled the euro down as well. Yet there were no strong reasons for the pound's decline in recent days—the BoE took an absolutely neutral stance, UK inflation was unchanged and matched forecasts, and the unemployment rate was also steady and aligned with market expectations. The same can be said for the Fed meeting. If there's a single word to characterize the tone of that meeting, it's "dovish." Thus, in essence, the dollar should have continued to fall on Wednesday evening. We believe the pair's current drop is just another technical correction—nothing more. The ascending trendline confirms that even the shortest-term bullish trend is intact.
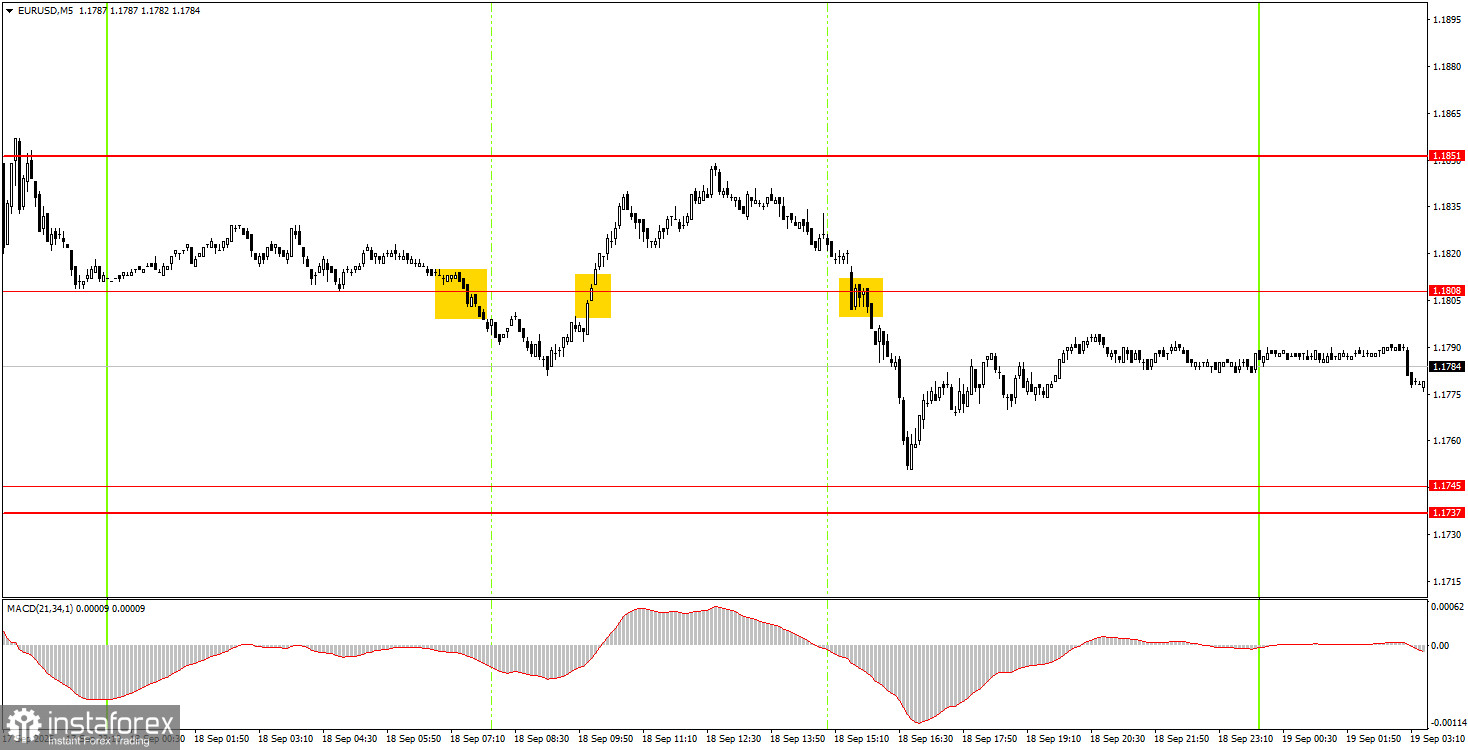
5M Chart of EUR/USD
On the 5-minute timeframe on Thursday, three signals were formed, and two more didn't materialize. The first signal, near the 1.1808 level, was a false one, but the price did move 15 pips in the right direction, so there shouldn't have been any loss. Then, a buy signal formed around the same level, and in this case, the nearest target was hit with a margin of just two pips—so you could even have considered selling at that point. A bit later, another sell signal appeared, after which the price nearly reached the 1.1745 level—only a 6-pip margin. Two out of three trades were profitable, and one broke even.
How to Trade on Friday:
On the hourly timeframe, the EUR/USD pair has every chance to continue its upward trend despite Thursday's drop. The fundamental and macroeconomic background remains disastrous for the US dollar, so we still do not expect any sustained dollar strength. In our view, the US currency can only count on technical corrections for now. The Fed meeting has not changed the outlook for the dollar.
On Friday, the EUR/USD pair may resume moving north, as the overall trend remains upward. From 1.1808 or from the 1.1737–1.1745 area, novice traders can look to buy again, targeting 1.1851 and 1.1908. Selling will become relevant only if the price consolidates below the 1.1737–1.1745 area, with targets at 1.1655–1.1666. In that case, the trend would turn bearish.
For the 5-minute timeframe, monitor the following levels: 1.1354–1.1363, 1.1413, 1.1455–1.1474, 1.1527, 1.1571–1.1584, 1.1655–1.1666, 1.1737–1.1745, 1.1808, 1.1851, 1.1908, 1.1970–1.1988. On Friday, there are no major events scheduled in either the Eurozone or the US, so the day is likely to be calm and measured.
Core Trading System Rules:
- Signal Strength: The shorter the time it takes for a signal to form (a rebound or breakout), the stronger the signal.
- False Signals: If two or more trades near a level result in false signals, subsequent signals from that level should be ignored.
- Flat Markets: In flat conditions, pairs may generate many false signals or none at all. It's better to stop trading at the first signs of a flat market.
- Trading Hours: Open trades between the start of the European session and the middle of the US session, then manually close all trades.
- MACD Signals: On the hourly timeframe, trade MACD signals only during periods of good volatility and a clear trend confirmed by trendlines or trend channels.
- Close Levels: If two levels are too close (5–20 pips apart), treat them as a support or resistance zone.
- Stop Loss: Set a Stop Loss to breakeven after the price moves 15 pips in the desired direction.
Key Chart Elements:
Support and Resistance Levels: These are target levels for opening or closing positions and can also serve as points for placing Take Profit orders.
Red Lines: Channels or trendlines indicating the current trend and the preferred direction for trading.
MACD Indicator (14,22,3): A histogram and signal line used as a supplementary source of trading signals.
Important Events and Reports: Found in the economic calendar, these can heavily influence price movements. Exercise caution or exit the market during their release to avoid sharp reversals.
Forex trading beginners should remember that not every trade will be profitable. Developing a clear strategy and practicing proper money management are essential for long-term trading success.