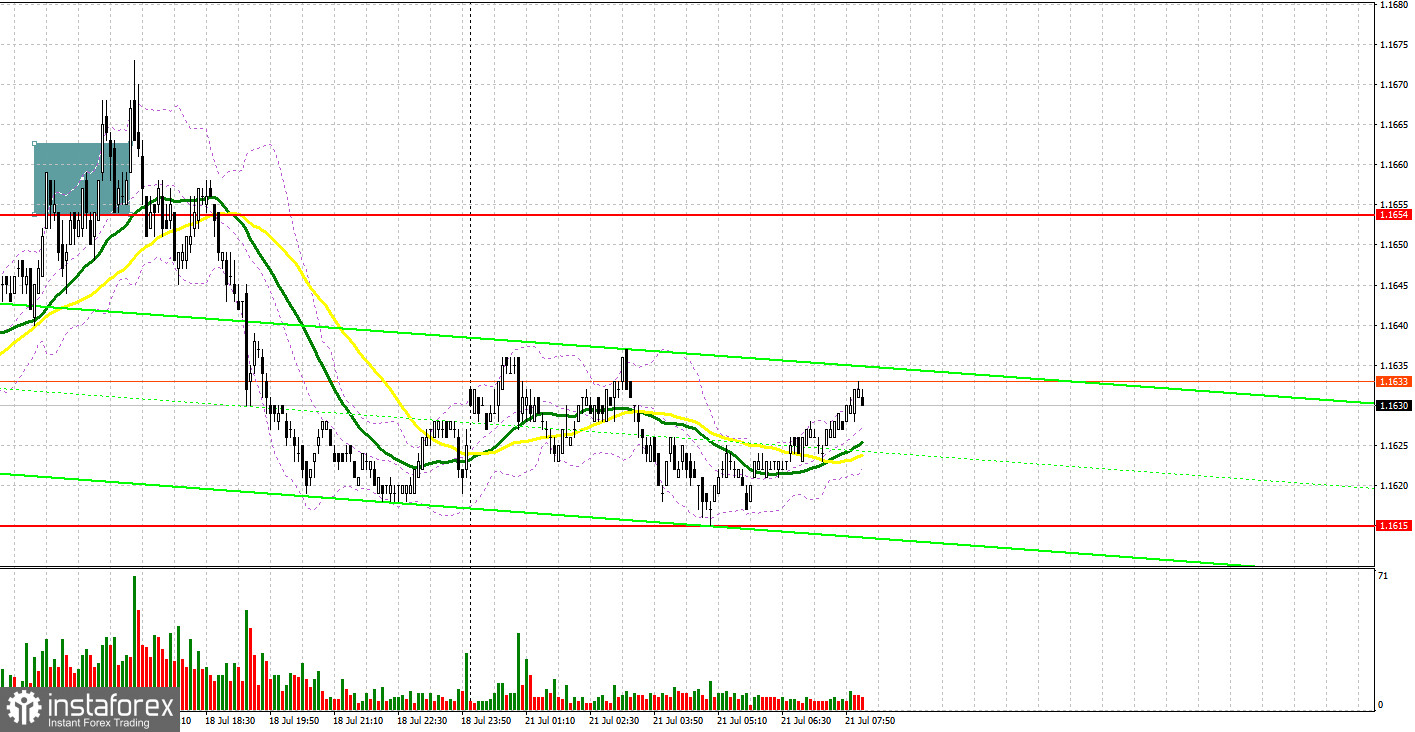
Only one market entry point was formed last Friday. Let's look at the 5-minute chart to see what happened. In my morning forecast, I highlighted the 1.1654 level as the reference point for entering the market. The pair did rise toward 1.1654, but a direct test of this level never occurred, so no trades were made. In the second half of the day, a false breakout near 1.1654 presented an opportunity for short positions, resulting in a decline of more than 30 pips.
To open long positions on EUR/USD:
German CPI data came in slightly above economists' forecasts, which supported the euro's rise. However, by the end of the week, the euro failed to consolidate near the recent highs, as U.S. housing market figures also exceeded expectations, strengthening the dollar. Today, no economic data is scheduled for the eurozone during the first half of the day, so the EUR/USD pair may find some temporary balance. In the absence of fresh data, a continuation of the upward correction is also unlikely.
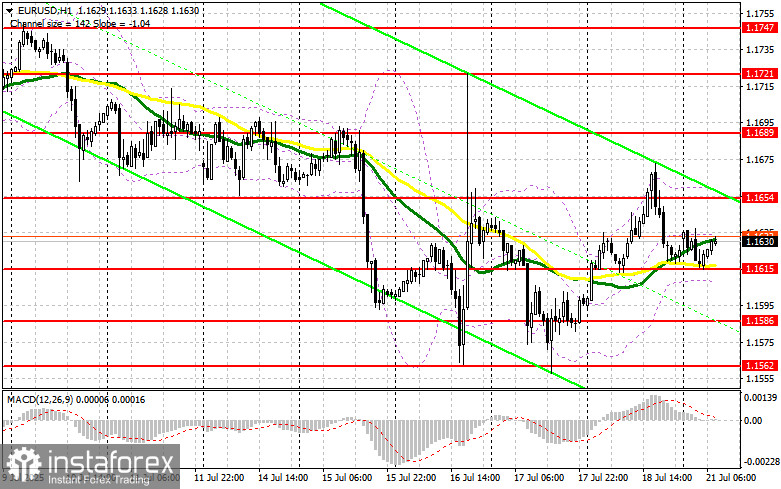
If EUR/USD moves downward, I will only consider action near the nearest support at 1.1615, which was formed last Friday. A false breakout at that level will signal an entry into the market, targeting a rise toward the 1.1654 resistance. A breakout and retest of this range will confirm a proper buy signal and may lead to a further increase to 1.1689. The ultimate target will be the 1.1721 area, where I plan to take profit.
If the EUR/USD pair drops and shows no activity around 1.1615, selling pressure will increase significantly, potentially pushing it toward the more attractive support level at 1.1586. Only a false breakout at that level will be a suitable condition for euro purchases. I would consider opening long positions on a direct rebound from 1.1562, aiming for an intraday correction of 30–35 pips.
To open short positions on EUR/USD:
Sellers are still in no rush to return to the market, and it's unlikely they'll show strong activity today either. If EUR/USD continues to rise in the first half of the day, I will act only near the 1.1654 resistance. A false breakout there would serve as a signal to sell the euro, targeting support at 1.1615, where the moving averages—currently favoring the bulls—are located.
A breakout and consolidation below this range, followed by a retest from below, would be another strong sell signal, leading to a move toward 1.1586. The final target will be the 1.1562 area, where I will take profit.
If the pair moves upward and sellers are inactive near 1.1654, it's better to postpone short positions until the next resistance at 1.1689, with selling considered only after a failed consolidation. I plan to open short positions on a direct rebound from 1.1721, aiming for a 30–35-pip downward correction.
Recommended for Review:
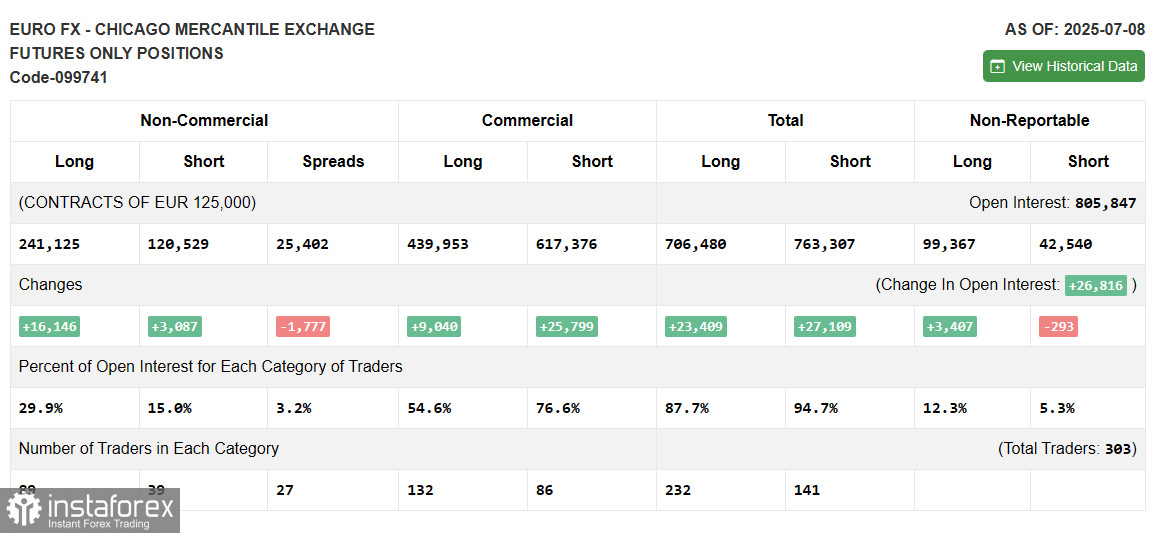
In the COT (Commitment of Traders) report for July 8, both long and short positions increased, but long positions grew significantly more. Traders continue to bet that the Federal Reserve will resume cutting interest rates this fall, which puts pressure on the dollar and supports euro growth.
Upcoming U.S. inflation data will be crucial for determining the direction of EUR/USD, as inflation is a key factor preventing the Fed from adjusting its monetary policy.
The COT report shows that:
- Non-commercial long positions rose by 16,146 to 241,125,
- Non-commercial short positions increased by 3,087 to 120,529,
- The net long position narrowed by 1,777.
Indicator Signals:
Moving Averages
Trading is taking place around the 30- and 50-period moving averages, indicating market uncertainty.
Note: The author analyzes moving averages on the H1 chart, which differs from the classic daily (D1) moving average definitions.
Bollinger Bands
If the pair declines, the lower Bollinger Band around 1.1605 will serve as support.
Indicator Descriptions:
- Moving Average: Smooths out volatility and noise to indicate the current trend.
- Period 50 – yellow on the chart
- Period 30 – green on the chart
- MACD (Moving Average Convergence/Divergence):
- Fast EMA – period 12
- Slow EMA – period 26
- SMA – period 9
- Bollinger Bands: Measures volatility and trend; period 20
- Non-commercial traders: Speculators such as individual traders, hedge funds, and large institutions using futures for speculative purposes.
- Non-commercial long positions: Total open long positions held by non-commercial traders.
- Non-commercial short positions: Total open short positions held by non-commercial traders.
- Net non-commercial position: The difference between non-commercial long and short positions.