The GBP/USD currency pair also traded relatively calmly on Monday. While there were some price "swings," many traders and analysts had expected a much more significant move. The dollar strengthened once, then pulled back, strengthened again, and collapsed sharply in the second half of the day. On higher timeframes, it's clear that we're witnessing another moderate correction. The market has already factored in three significant bullish influences for the U.S. dollar. First, there is the escalation of conflicts between Iran and Israel. Second, Donald Trump's threats to involve the U.S. in the war against Iran. Finally, his actual military strike on three of Iran's nuclear facilities.
Markets typically respond most strongly to any geopolitical conflict's initial and most critical headlines. These early reactions trigger capital flight from involved countries and the shift from risk assets to safe havens. The Ukraine–Russia conflict has been ongoing for over four years now, yet news of missile strikes or territorial advances no longer triggers a dollar rally, as markets have already made the risk-off adjustment. Similarly, the U.S. dollar can no longer expect consistent gains from military activity in the Middle East.
Meanwhile, numerous military experts and topographers have expressed doubt that Iran's nuclear facilities were truly "completely destroyed." Satellite images confirm that U.S. bombs hit the site in Fordow, but that facility is located more than 50 meters underground. A surface hit does not guarantee internal destruction.
The same satellite images show six craters or bomb impact points from GBU-57 munitions, but it's impossible to verify whether they reached their targets underground. In any case, the sites had been evacuated in advance, and the strikes were aimed at areas with the thickest mountain rock, where uranium enrichment was likely taking place. Thus, there is no guarantee that the sites were destroyed—yet Trump could not afford to declare anything less than "total victory."
We believe market participants will soon tire of the narrative surrounding another Middle East war. Instead, the focus is likely to return to the Global Trade War. The critical date of July 9 is fast approaching—the deadline Trump gave to 74 countries for trade negotiations. On that day, Trump will either reinstate the original tariffs or extend the grace period.
So far, no progress has been observed in talks with key partners. The European Union has stated that Washington's demands are contradictory and unclear to Brussels. Some of the ultimatums are impossible to comply with due to internal EU laws. Overall, the negotiations resemble a list of demands without the willingness to compromise. Thus, we believe that Trump's trade standoff is still in its early stages, and many more events ahead will be difficult to frame as bullish for the dollar.
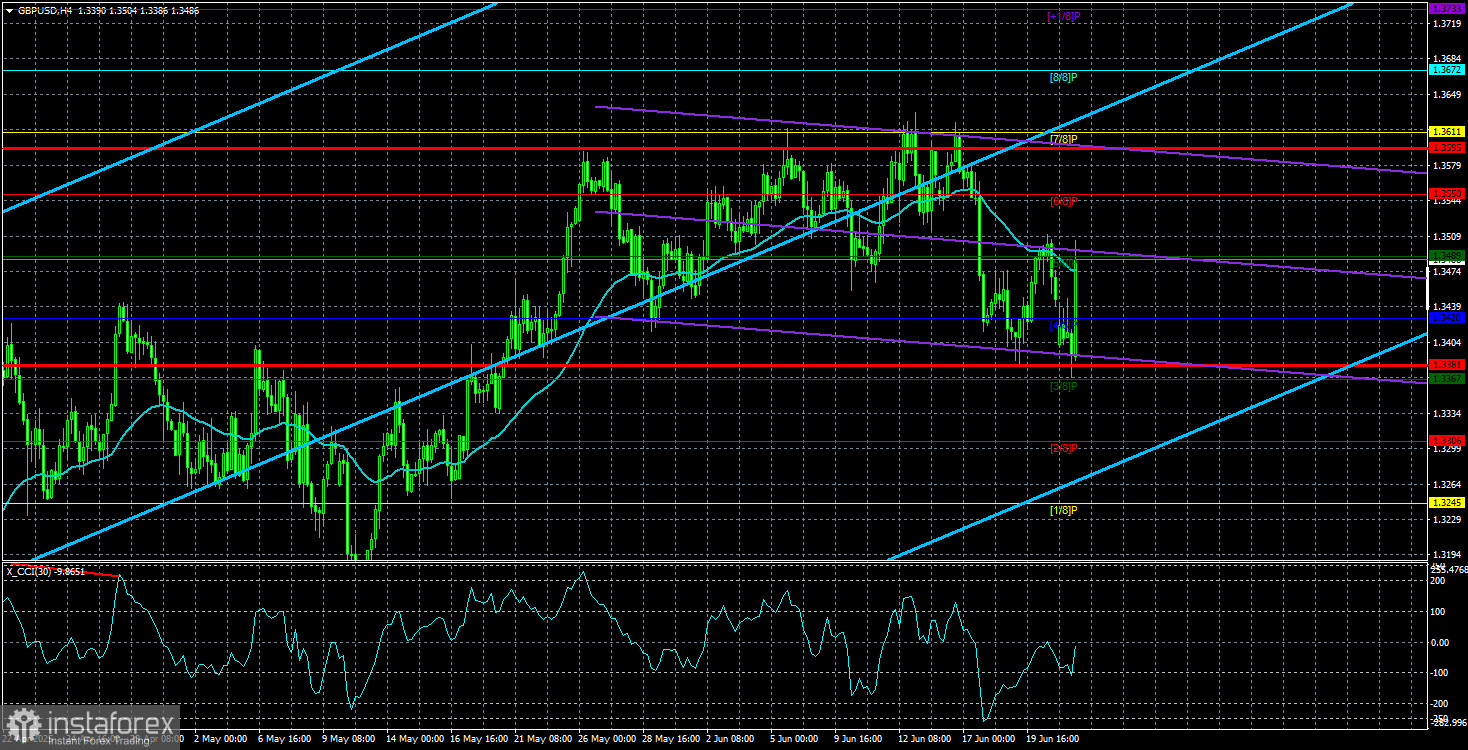
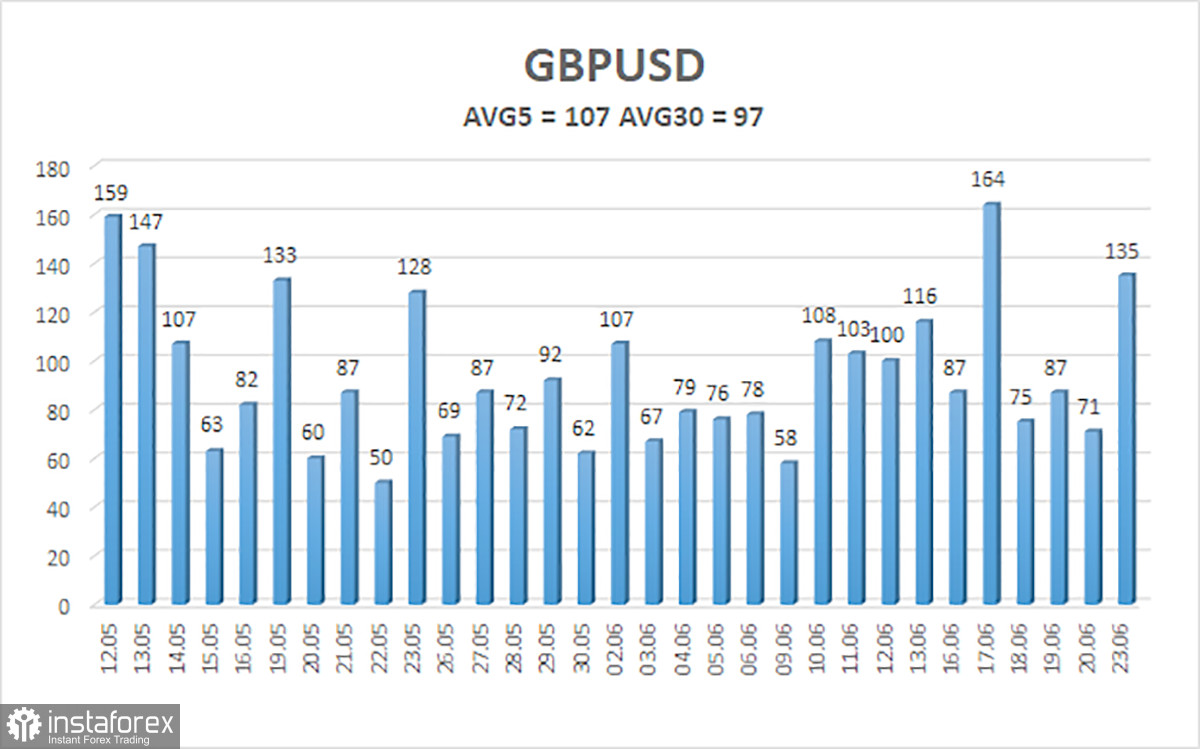
The average volatility of the GBP/USD pair over the last five trading days is 107 pips, which is considered "moderate" for this pair. On Tuesday, June 24, we expect movement within the range of 1.3381 to 1.3595. The long-term regression channel continues to point upward, indicating a clear uptrend. This week, the CCI indicator entered the oversold zone, which could renew the bullish trend.
Nearest Support Levels:
S1 – 1.3428
S2 – 1.3367
S3 – 1.3306
Nearest Resistance Levels:
R1 – 1.3489
R2 – 1.3550
R3 – 1.3611
Trading Recommendations:
The GBP/USD pair remains in an uptrend, although it is undergoing a correction. In the medium term, Trump's policies will likely continue to pressure the dollar. However, the dollar may see occasional strength in the short term due to Middle East tensions. Long positions targeting 1.3550 and 1.3595 remain relevant if the price stays above the moving average. If the price falls below the moving average and considering recent news, short positions targeting 1.3381 and 1.3367 can be considered. Still, we do not expect strong dollar growth. Periodic corrections are possible, but the dollar needs clear signs that the Global Trade War is ending for a sustainable rally.
Explanation of Illustrations:
Linear Regression Channels help determine the current trend. If both channels are aligned, it indicates a strong trend.
Moving Average Line (settings: 20,0, smoothed) defines the short-term trend and guides the trading direction.
Murray Levels act as target levels for movements and corrections.
Volatility Levels (red lines) represent the likely price range for the pair over the next 24 hours based on current volatility readings.
CCI Indicator: If it enters the oversold region (below -250) or overbought region (above +250), it signals an impending trend reversal in the opposite direction.