EUR/USD
Analysis:
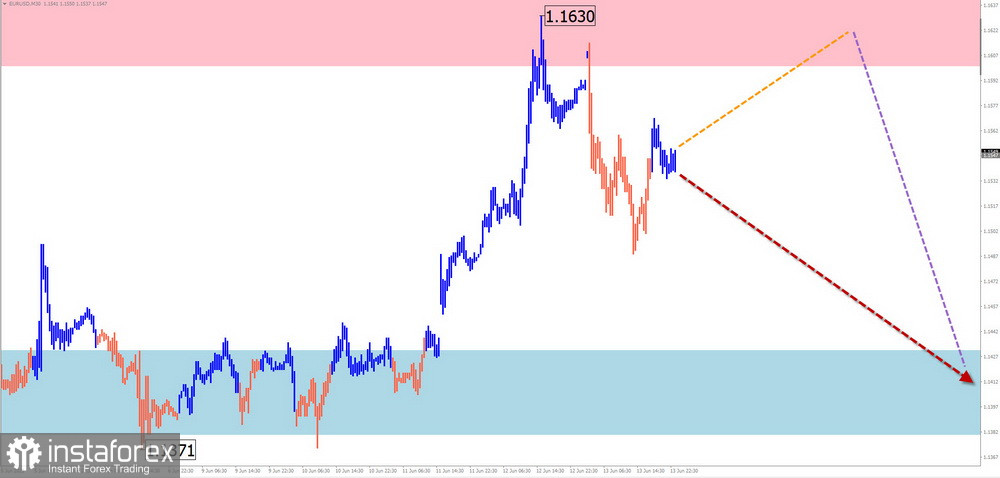
Short-term analysis of the euro's chart since February shows a dominant upward trend. In recent months, a corrective flat pattern has been forming, which remains incomplete. The price has reached the lower boundary of a strong potential reversal zone. The downward movement starting on June 12 holds reversal potential.
Forecast:
The week is expected to be flat for the euro. A reversal and a downward move are likely from the resistance zone by midweek. The projected support zone marks the probable end of the correction.
Potential Reversal Zones:
- Resistance: 1.1600 / 1.1650
- Support: 1.1430 / 1.1380
Recommendations:
- Buying: No conditions for such trades in the upcoming week.
- Selling: Possible in partial volumes during specific sessions, following confirmed reversal signals.
USD/JPY
Analysis:
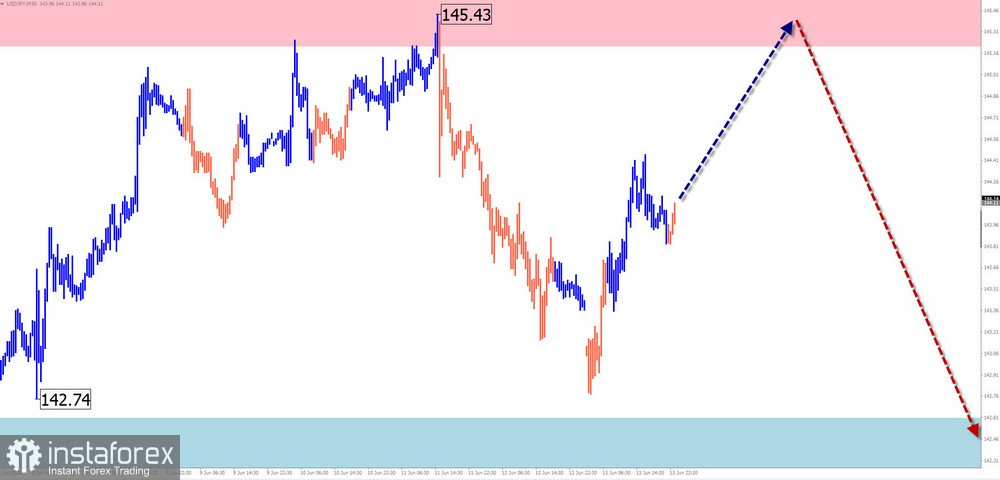
Since December last year, the main trend in USD/JPY has followed a downward wave. A counter-trend correction developed from early April. Since May 12, a reversal wave pattern has been forming. Over the past two weeks, the price has moved within a horizontal channel, forming a "horizontal pennant" pattern.
Forecast:
Early in the week, the current sideways trend is likely to continue, with gradual growth toward the resistance zone. Toward the weekend, increased volatility, a reversal, and resumed price decline are expected. The projected support may slow the weakening within the weekly range.
Potential Reversal Zones:
- Resistance: 145.20 / 142.70
- Support: 142.60 / 142.10
Recommendations:
- Buying: Low potential, risky.
- Selling: May become relevant after confirmation signals near resistance.
GBP/JPY
Analysis:
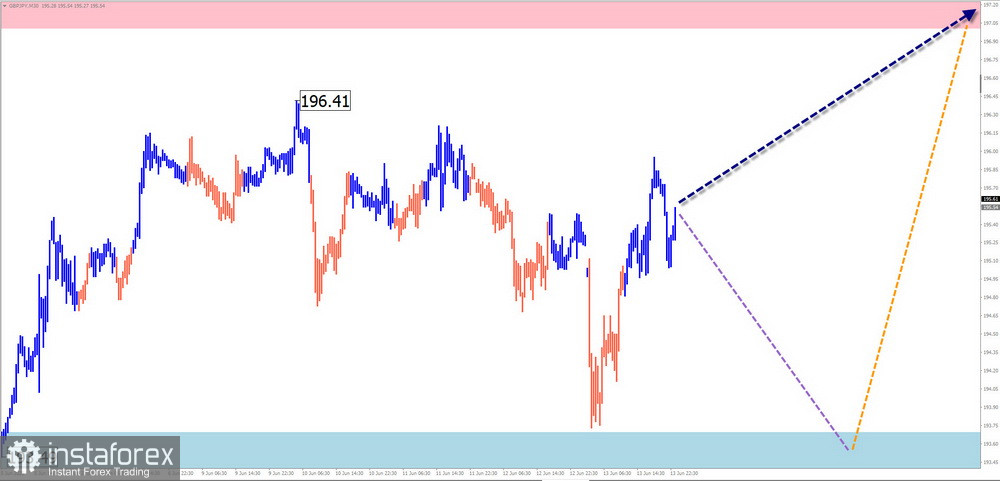
The GBP/JPY pair continues its upward movement. Since mid-May, a counter-trend correction has been developing, resembling an "expanding flat" pattern. Recently, the price has moved along the lower boundary of the weekly support zone. The final segment of the wave is missing.
Forecast:
After a rise and potential test of the resistance zone early in the week, a reversal and downward movement toward projected support are expected. The highest volatility is likely closer to the weekend.
Potential Reversal Zones:
- Resistance: 197.00 / 197.50
- Support: 193.70 / 193.20
Recommendations:
- Selling: Premature until confirmed reversal signals appear near resistance.
- Buying: Low potential, safer to reduce volume size.
USD/CAD
Analysis:
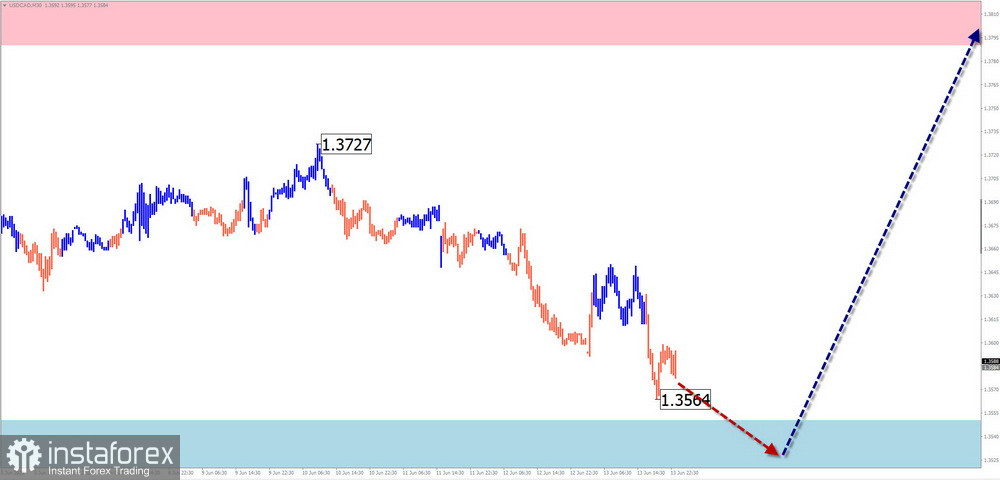
The daily timeframe for USD/CAD shows a downward wave since February. The structure currently appears complete. However, no clear reversal signals are present yet. The price remains within a strong higher timeframe potential reversal zone.
Forecast:
A test of the support zone is possible in the coming days, followed by a reversal and upward movement toward the resistance zone.
Potential Reversal Zones:
- Resistance: 1.3790 / 1.3840
- Support: 1.3550 / 1.3500
Recommendations:
- Selling: No conditions for such trades this week.
- Buying: May be possible once reversal signals appear on your trading systems.
NZD/USD
Brief Analysis:
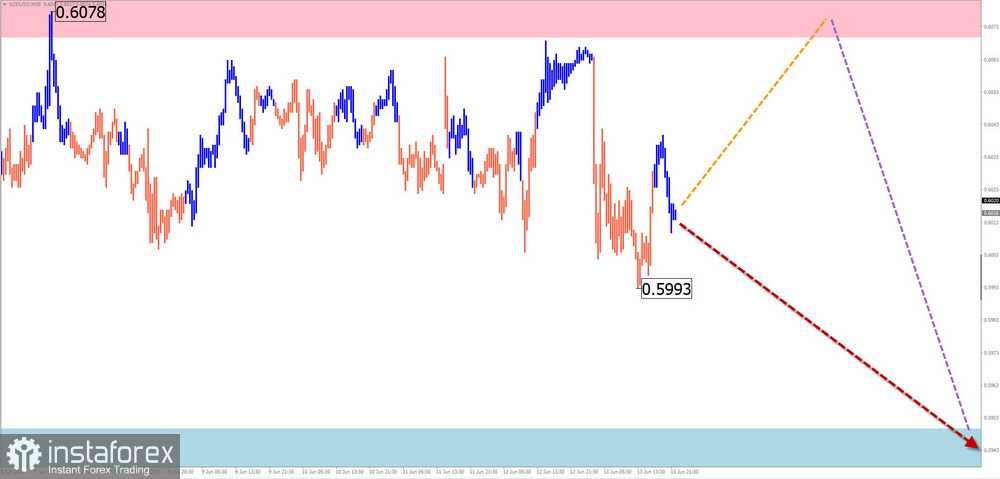
Since April, NZD/USD has maintained an upward trend. The recent flat correction remains incomplete. The price moves near the upper boundary of a potential daily reversal zone.
Weekly Forecast:
The beginning of the week may see the end of the upward vector, transitioning into sideways movement within the resistance zone. Once reversal conditions are in place, a downward trend toward the projected support zone is expected.
Potential Reversal Zones:
- Resistance: 0.6070 / 0.6120
- Support: 0.5950 / 0.5900
Recommendations:
- Buying: Risky, potentially unprofitable.
- Selling: May be used once reversal signals appear near the support zone.
GOLD
Analysis:
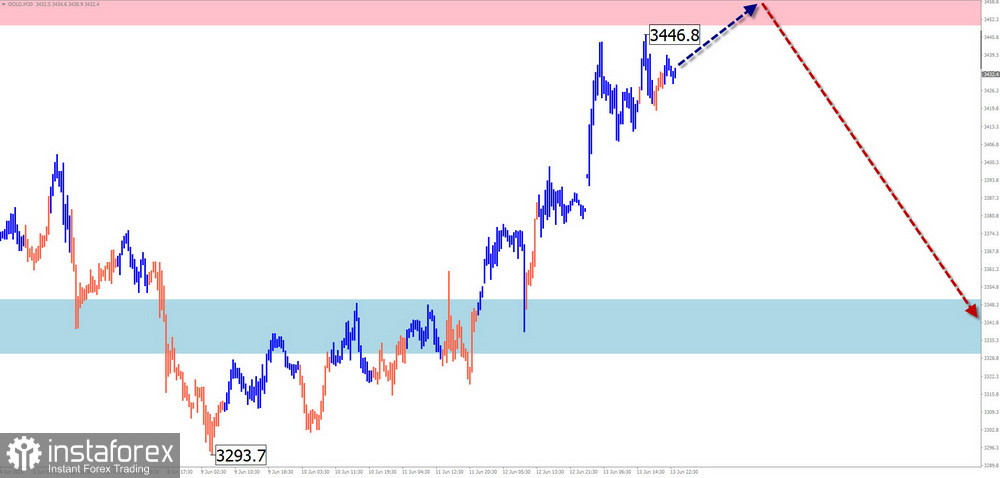
Since April 22, gold has been forming a downward wave, appearing as an "expanding flat" pattern. The price continues to move near the lower boundary of the weekly reversal zone. The final wave segment (C) of the correction is still missing.
Forecast:
Gold's current upward momentum may end within the coming days. There is a high probability of a test of the resistance zone, possibly with a brief breakout. A reversal and downward movement are more likely toward the weekend.
Potential Reversal Zones:
- Resistance: 3450.0 / 3470.0
- Support: 3350.0 / 3330.0
Recommendations:
- Buying: No conditions for such trades this week.
- Selling: May be used after confirmed reversal signals appear.
Note: In simplified wave analysis (SWA), all waves consist of three parts (A-B-C). Only the last, incomplete wave is analyzed on each timeframe. Dashed lines represent expected movements.
Caution: The wave algorithm does not account for the duration of market movements over time.