The GBP/USD currency pair fell sharply in the first half of Tuesday but retraced back to its original position in the second half. Traders may have assumed in the morning that the U.S. dollar had finally begun to strengthen (although based on what?), but the market proved otherwise. The only possible reason for the pair's decline in the first half of the day was weaker-than-expected UK economic data. The unemployment rate increased, jobless claims rose, and average earnings declined. But let's examine whether the data was that bad to justify a nearly 100-pip drop in the pound.
The unemployment rate did increase, and that's undeniable. But it rose in line with forecasts—to 4.6%. It's worth remembering that what's important is not the figure itself but whether it met or missed expectations. Since there was no deviation from the forecast, there was no real reason for the pound to fall. The jobless claims report showed an increase of 30,000 compared to a forecast of 10,000. Yes, that's a bearish factor for the pound, but was it strong or abrupt enough to justify such a sharp decline? Average earnings growth slowed to 5.3%, but what does that affect? If we're talking about the Bank of England's monetary policy—then nothing. At its last meeting, the BoE lowered the key interest rate and made it clear it wouldn't rush further cuts. In any case, inflation indicators are more critical than wage growth.
Thus, we believe the market overreacted to the reports, especially considering that in the past, it has often ignored secondary reports—particularly those suggesting USD purchases. On Tuesday morning, the dollar surged as if Donald Trump had announced a trade truce. However, just a few hours later, everything returned to normal. The dollar started to weaken again and, during the U.S. session, retraced its earlier gains.
Looking ahead to Wednesday, we expect a genuinely important and interesting report, but unfortunately, it's unlikely to have a decisive impact. We might again see a strong momentary reaction, but the dollar is unlikely to strengthen, even in the short term. Inflation in the U.S. currently doesn't influence monetary policy because the Federal Reserve is waiting for a "final reading" after Trump's tariffs fully manifest. Given the current uncertainty—what tariffs will stay, which will increase, decrease, or be removed—what meaningful conclusions can be drawn about inflation or economic slowdown? The Fed and Jerome Powell have clearly stated they expect a surge in inflation and are unwilling to risk lowering the rate prematurely. Therefore, today's report is unlikely to change the Fed's stance.
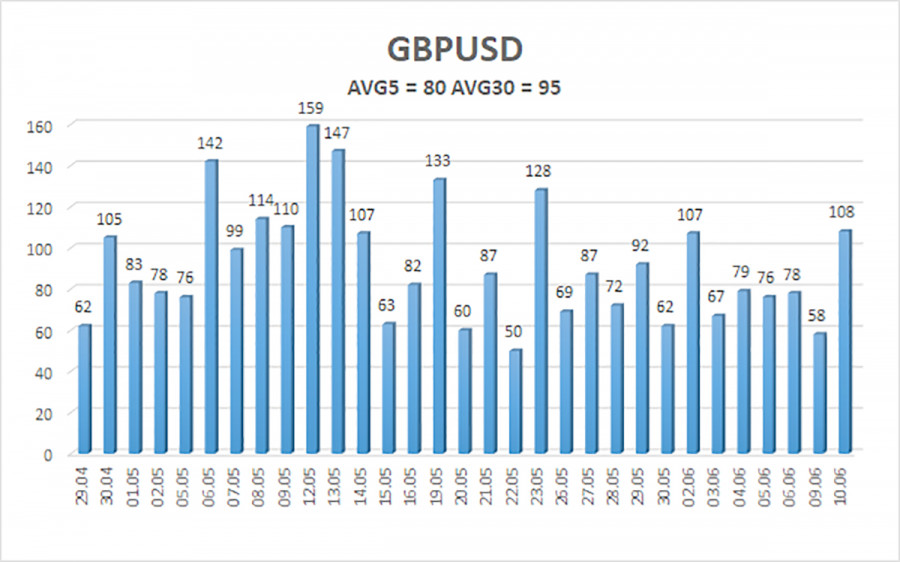
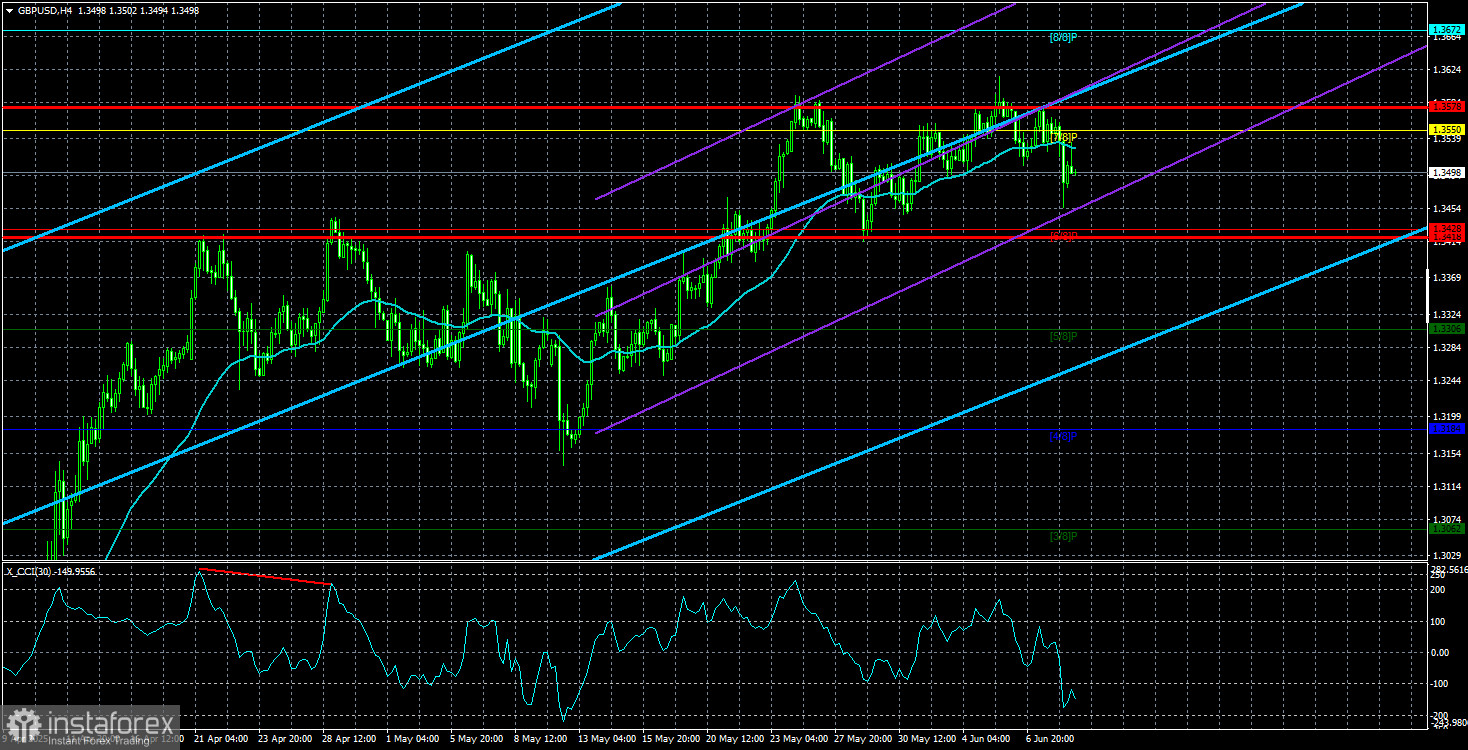
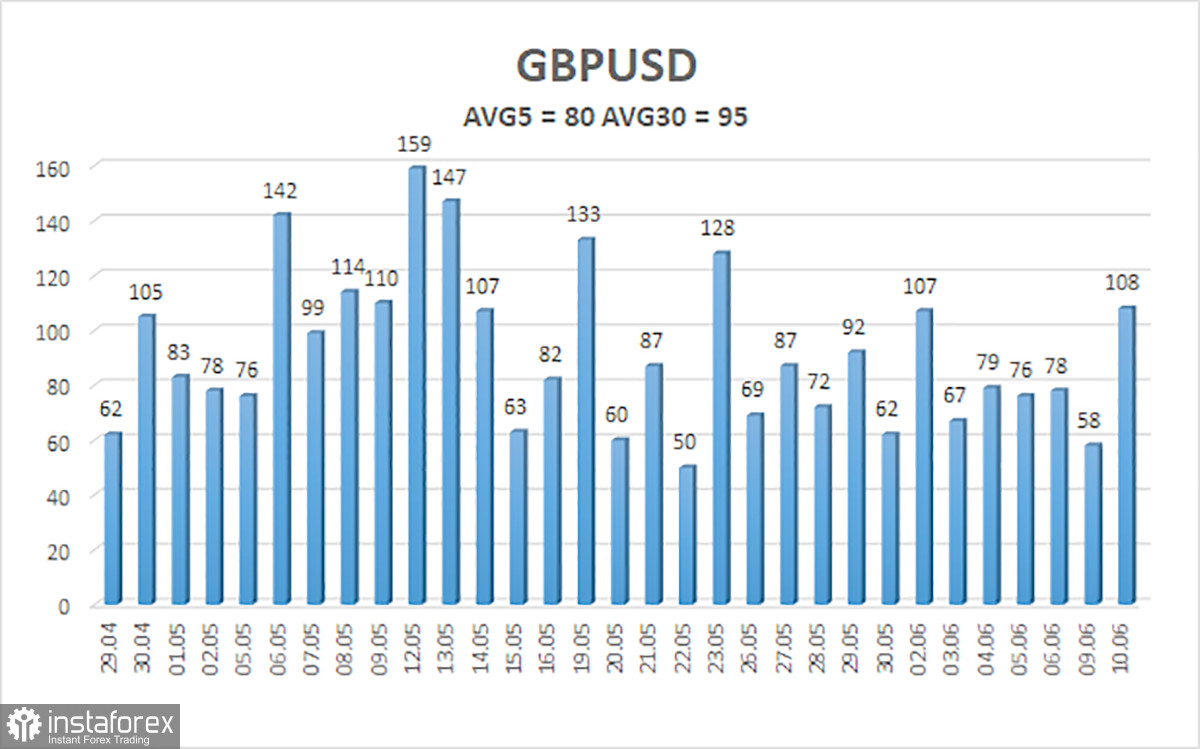
The average volatility of the GBP/USD pair over the last five trading days is 80 pips, which is considered "moderate." On Wednesday, June 11, we expect movement within the range of 1.3418 to 1.3578. The long-term regression channel is directed upward, indicating a strong upward trend. The CCI indicator has not recently entered extreme zones.
Nearest Support Levels:
S1 – 1.3428
S2 – 1.3306
S3 – 1.3184
Nearest Resistance Levels:
R1 – 1.3550
R2 – 1.3672
R3 – 1.3794
Trading Recommendations:
The GBP/USD pair maintains its upward trend and continues to grow. And there is no shortage of news supporting this direction. The de-escalation of the trade conflict came and went, but the market's dislike for the dollar remains. Every new decision by Trump is viewed negatively by the market. Thus, long positions with targets at 1.3635 and 1.3672 are currently more relevant while the price remains above the moving average. A consolidation below the moving average makes short positions with targets at 1.3428 and 1.3418 viable—but who is expecting strong dollar growth right now? Occasionally, the dollar may show minor corrections. However, we need clear signs of de-escalation in the global trade war for a sustained rally.
Explanation of Illustrations:
Linear Regression Channels help determine the current trend. If both channels are aligned, it indicates a strong trend.
Moving Average Line (settings: 20,0, smoothed) defines the short-term trend and guides the trading direction.
Murray Levels act as target levels for movements and corrections.
Volatility Levels (red lines) represent the likely price range for the pair over the next 24 hours based on current volatility readings.
CCI Indicator: If it enters the oversold region (below -250) or overbought region (above +250), it signals an impending trend reversal in the opposite direction.