GBP/USD 5-Minute Analysis
The GBP/USD currency pair continued trading rather chaotically on Tuesday but with a bearish tone. The British pound at least slightly declined after the trend shifted downward. Recall that a few days ago, the price broke through another trend line (channel), indicating the formation of a new downward trend. However, in previous instances, we saw no real decline. And even if there was one, it ended very quickly.
In principle, we've been saying the same thing for three months: movements in the currency market now depend solely on the figure of Donald Trump. The U.S. president makes many unilateral decisions that will profoundly impact the American and global economy, creating a new trade architecture in the world with unclear consequences. Thus, the market's logic is and remains very simple: the more questionable decisions Trump makes and the more absurd statements he delivers, the less willing the market is to buy the dollar.
Strangely enough, the U.S. currency did gain slightly on Tuesday, and the market even responded to macroeconomic data from the UK, which it had previously ignored. Data from the UK went against the British currency, although the unemployment report (the most important among the data) aligned with forecasts. Therefore, one could argue that the pound fell somewhat undeservedly. And there were certainly no strong fundamental reasons to support a dollar rally.
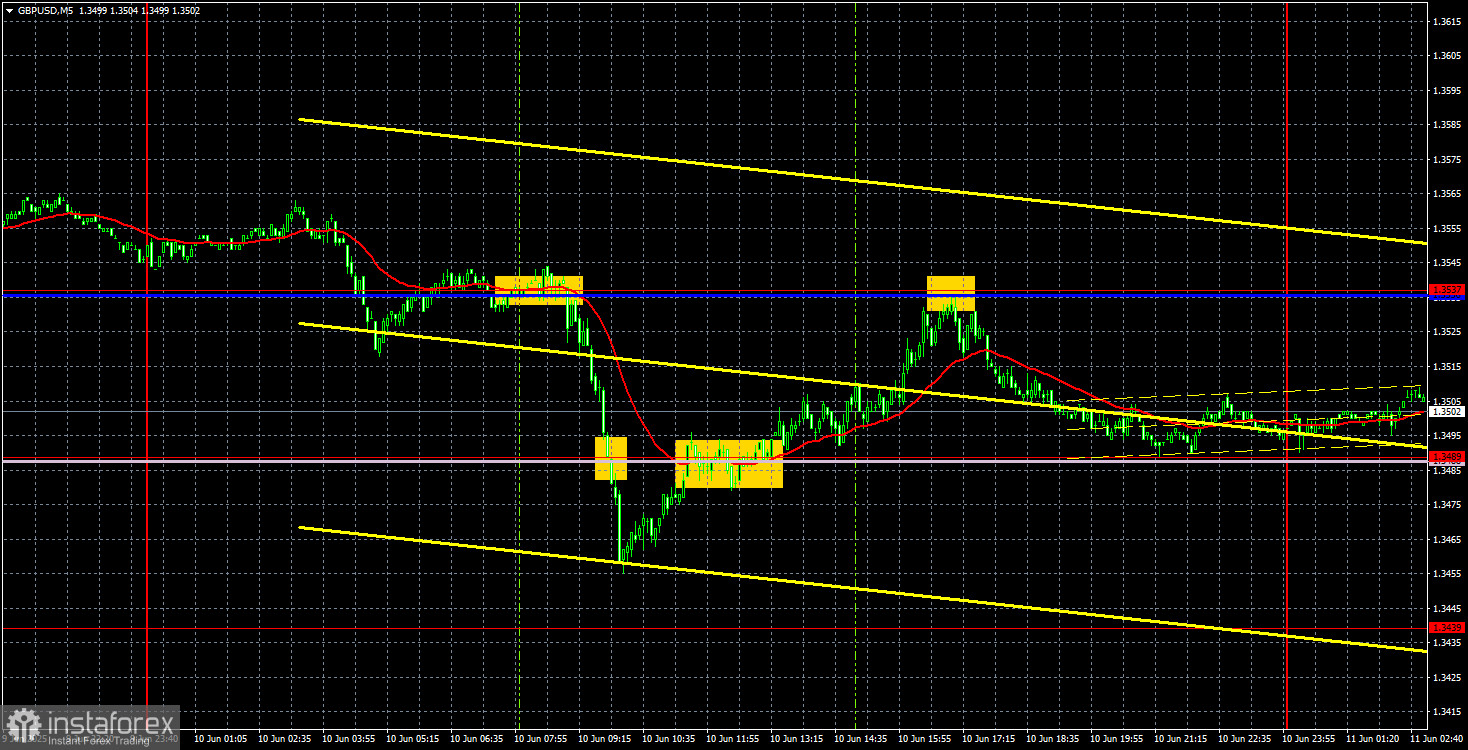
On the 5-minute TF, the pair generated several trading signals and changed direction throughout the day. The very first sell signal near the critical line yielded about 30 pips. More could have been gained, but the buy signal near the Senkou Span B line was unsuccessful. Still, it also yielded about 30 pips. Finally, the pair bounced off the Kijun-sen line and returned to the Senkou Span B line by the end of the day. Another 30 pips in the money box.
COT Report
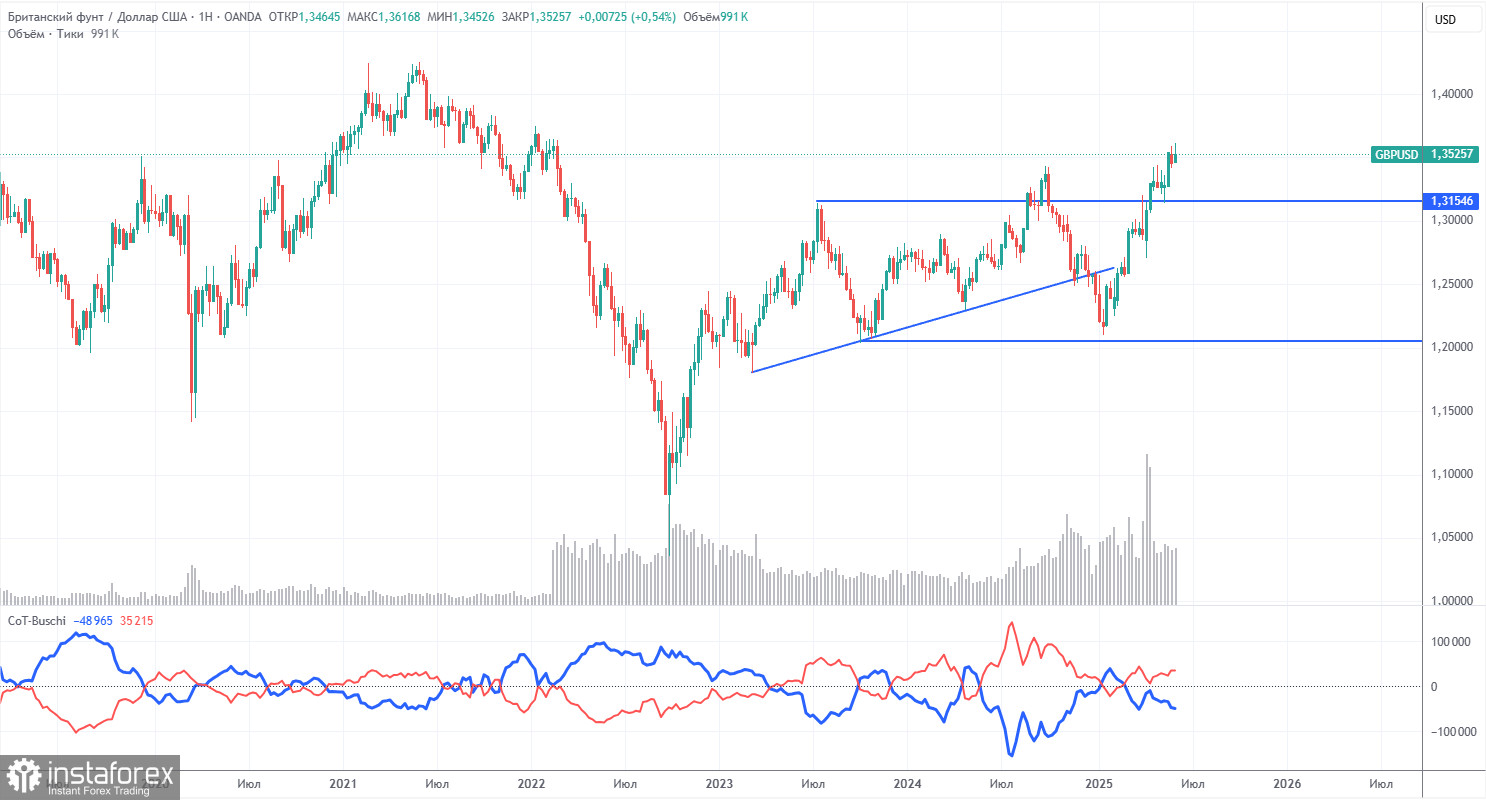
The COT reports for the British pound show that commercial traders' sentiment has constantly changed in recent years. The red and blue lines, representing the net positions of commercial and non-commercial traders, constantly cross and are usually near the zero mark. They are currently close to each other, indicating a roughly equal number of buy and sell positions. However, the net position has been increasing over the last year and a half.
The dollar continues to fall due to Donald Trump's policies, so market makers' demand for the pound sterling is not very important at the moment. If de-escalation of the global trade war resumes, the U.S. dollar will have a chance for some strengthening. According to the latest COT report on the pound, the "Non-commercial" group opened 1,300 BUY contracts and 1,400 SELL contracts. Thus, the net position of non-commercial traders barely changed for the reporting week.
Recently, the pound has risen significantly, but it's important to note that there's only one reason: Trump's policy. Once that factor is neutralized, the dollar could rise, but no one knows when that will happen. The pound itself has no fundamental reasons for growth. Nevertheless, traders are more than satisfied with the "Trump factor" when making trading decisions.
GBP/USD 1-Hour Analysis
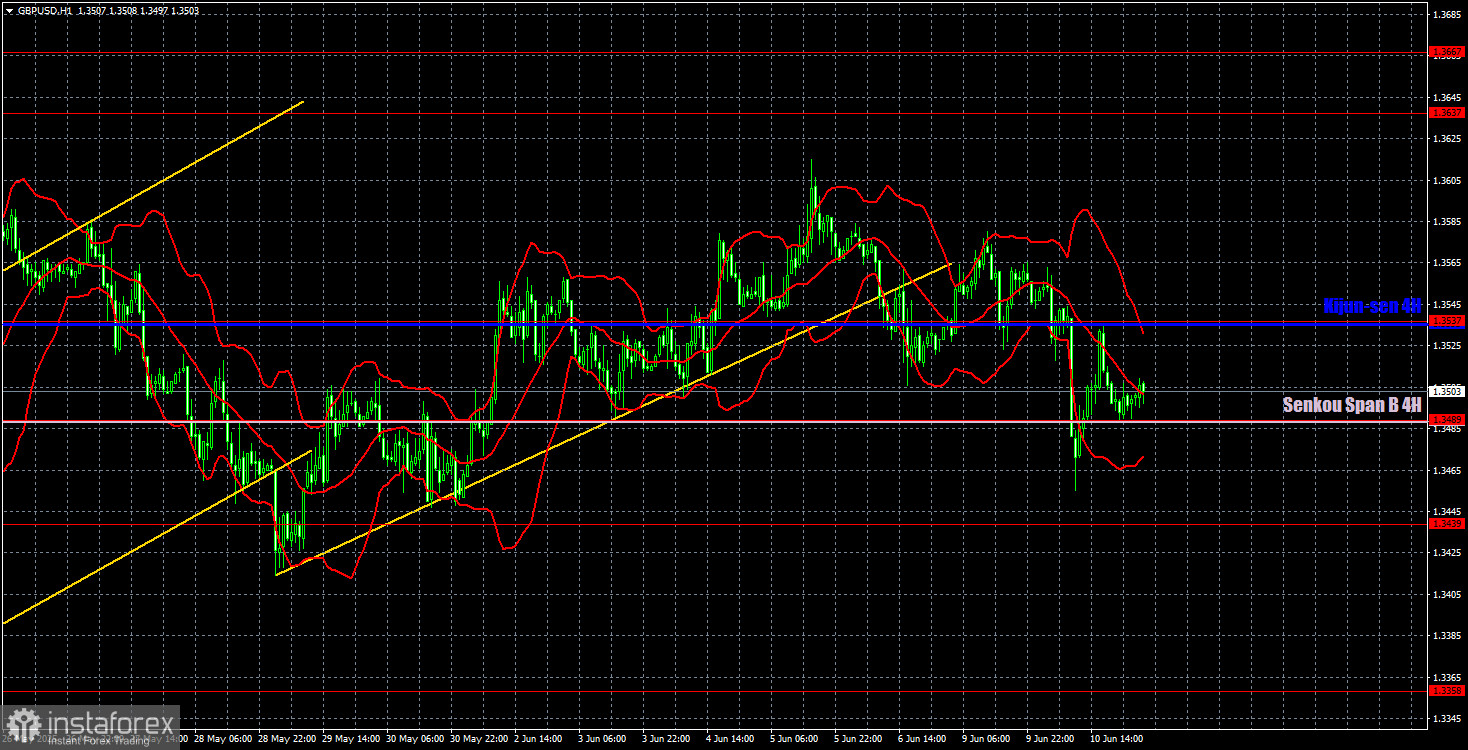
In the hourly timeframe, the GBP/USD pair retains its upward trend despite closing below the ascending channel and the ascending trend line. The U.S. dollar is slightly increasing, but there are no clear reasons beyond technical ones. The price failed to break through the Senkou Span B line confidently, but it will get a second chance. Overall, even if the dollar strengthens for several more days, the 4-hour TF shows a sideways movement in recent weeks, while the daily TF indicates a strong upward trend.
For June 11, we highlight the following key levels: 1.2981–1.2987, 1.3050, 1.3125, 1.3212, 1.3288, 1.3358, 1.3439, 1.3489, 1.3537, 1.3637–1.3667, 1.3741. The Senkou Span B (1.3489) and Kijun-sen (1.3535) lines can also be sources of signals. A Stop Loss level is recommended to be set at breakeven once the price moves 20 pips in the correct direction. The Ichimoku indicator lines may shift during the day, so this should be considered when identifying trading signals.
No significant events are scheduled in the UK on Wednesday, while in the U.S., a fairly significant inflation report will be published. This important release may trigger an immediate market reaction. If inflation rises, the dollar could receive market support, even though it previously didn't respond to similar reports.
Illustration Explanations:
- Support and resistance price levels – thick red lines where movement may end. They are not trading signal sources.
- Kijun-sen and Senkou Span B lines—These are strong Ichimoku indicator lines transferred to the hourly timeframe from the 4-hour one.
- Extremum levels – thin red lines where the price has previously rebounded. These act as trading signal sources.
- Yellow lines – trend lines, trend channels, and other technical patterns.
- COT Indicator 1 on the charts – the size of the net position for each category of traders.