empty
 
 
02.06.2025 12:36 PM
Bitcoin's technical outlook appears promising

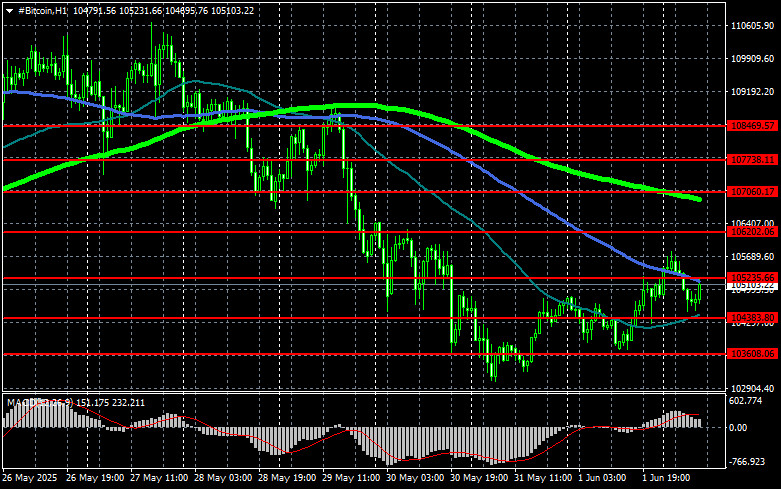
Bitcoin appears to have found a bottom near $104,000 and is currently trading around $104,500 in early June.

This image is no longer relevant

It is evident that the cryptocurrency is positioned at a psychological and technical inflection point, one that could determine the success or failure of the next bullish trend.

In the short term, technical indicators like the RSI and MACD suggest that the strong bullish momentum may be gradually weakening. However, the long-term outlook remains optimistic, with growing conviction among analysts and market participants that we could be in the early stages of a new supercycle.

Key support for Bitcoin remains around $103,000, with a more substantial base forming near $97,600. If BTC can hold above the $103,000–$105,000 range, there is potential for a fresh rally toward $115,000. Conversely, a breakdown below $103,000 could lead to a deeper correction, targeting the $93,000–$97,000 range.

Even in this bearish case, it should not be seen as the end of the broader uptrend, but rather as an indication that the market may require more time to consolidate before resuming upward momentum.

This image is no longer relevant

Trading recommendations:

Buyers of BTC are currently aiming to reclaim $105,200, a level that would pave the way for $106,200, followed closely by $107,000. The ultimate upside target is $107,700, a breakout above which would strengthen the bullish market structure. In the event of a decline, buyers are expected to re-enter around $104,300. A drop below this area could quickly push BTC toward $103,600, with a deeper target at $102,800.

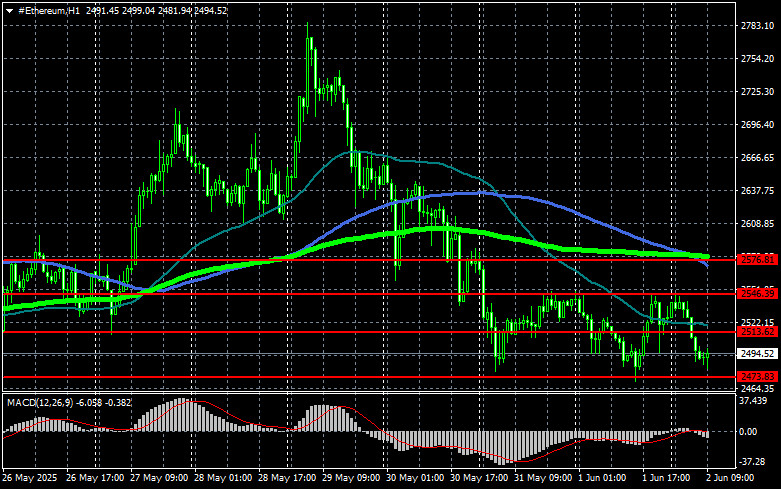
As for ETH, clear consolidation above $2,513 would open the way toward $2,546, with the final upside target at $2,576, a level that would confirm the formation of a bullish trend.

Should ETH decline, support is seen around $2,473. A move below this area could drag ETH down to $2,441, with a final downside target near $2,412.

This image is no longer relevant

What we see on trading charts:

  • Red lines: support and resistance zones expected to cause either a pause or a sharp price move
  • Green line: 50-day moving average
  • Blue line: 100-day moving average
  • Light green line: 200-day moving average

The crossing or testing of these moving averages often signals trend reversals or momentum shifts in the market.

Jakub Novak,
Analytical expert of InstaForex
© 2007-2025
Earn on cryptocurrency rate changes with InstaForex
Download MetaTrader 4 and open your first trade
  • Grand Choice
    Contest by
    InstaForex
    InstaForex always strives to help you
    fulfill your biggest dreams.
    JOIN CONTEST
  • Chancy Deposit
    Deposit your account with $3,000 and get $1000 more!
    In June we raffle $1000 within the Chancy Deposit campaign!
    Get a chance to win by depositing $3,000 to a trading account. Having fulfilled this condition, you become a campaign participant.
    JOIN CONTEST
  • Trade Wise, Win Device
    Top up your account with at least $500, sign up for the contest, and get a chance to win mobile devices.
    JOIN CONTEST
  • 100% Bonus
    Your unique opportunity to get a 100% bonus on your deposit
    GET BONUS
  • 55% Bonus
    Apply for a 55% bonus on your every deposit
    GET BONUS
  • 30% Bonus
    Receive a 30% bonus every time you top up your account
    GET BONUS

Recommended Stories

Can't speak right now?
Ask your question in the chat.
Widget callback