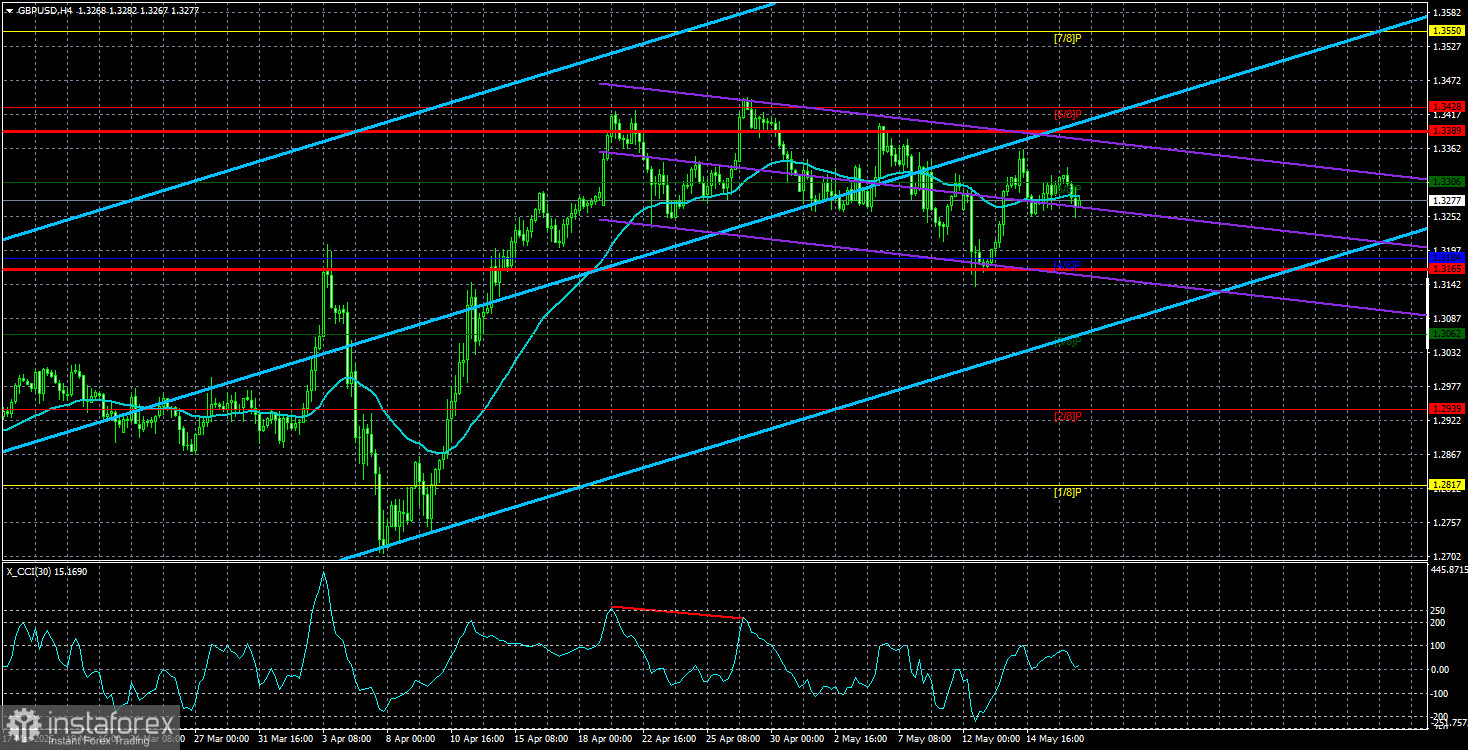
The GBP/USD currency pair continued to move sideways on Friday, a trend that has persisted for a month. As the 4-hour chart clearly illustrates, the price mostly moves sideways. While this is not a classic flat channel with clearly defined boundaries suitable for trading setups, a slight downward tilt is present. Nonetheless, we still consider these movements to be sideways.
One of the cornerstone issues for the U.S. economy remains inflation. Jerome Powell and his colleagues are reluctant to cut the key rate due to the risk of accelerating inflation. However, inflation in the U.S. fell to 2.3% year-over-year in April and shows no reaction to Trump's tariffs. As a result, Trump continues to demand monetary easing, and the market continues to price in far more easing than the Federal Reserve is likely to deliver.
We maintain that the Fed's full easing cycle was completed between 2022 and 2024. Thus, a renewed cycle should not lead to a significant dollar drop, as this scenario has long been priced in. Still, one must remember that the market currently uses any—even superficial—excuse to sell the dollar. Therefore, the eventual start of a new rate-cutting cycle (which will inevitably come) could still trigger another round of dollar weakness.
As for inflation itself, we consider its reacceleration to be nearly inevitable. While April data did not show an increase, May or June could bring changes. As such, we do not expect the Fed to ease policy in the near term, which could theoretically support the dollar. However, while the dollar shows some gains against the euro, it barely rises against the British pound, which continues to demonstrate remarkable resilience.
The conclusion is clear: in the EUR/USD pair, the dollar may continue to strengthen, as the European Central Bank is aggressively easing its monetary policy, and the euro lacks the pound's resilience. If the pound begins to correct downward, it's likely to be very weak. The state of the British or European economy currently has little impact.
Also, the Bank of England's policy is worth noting—it has already cut rates twice in 2025. Yet this fundamental factor has virtually no effect on the GBP/USD pair. So, if EUR/USD shows only a mild correction, GBP/USD might demonstrate an even weaker one.
We see a minimal downward slope from a technical perspective, but it is so weak that the price regularly rises above the moving average line. Therefore, in our view, short positions on the pound are currently not advisable.
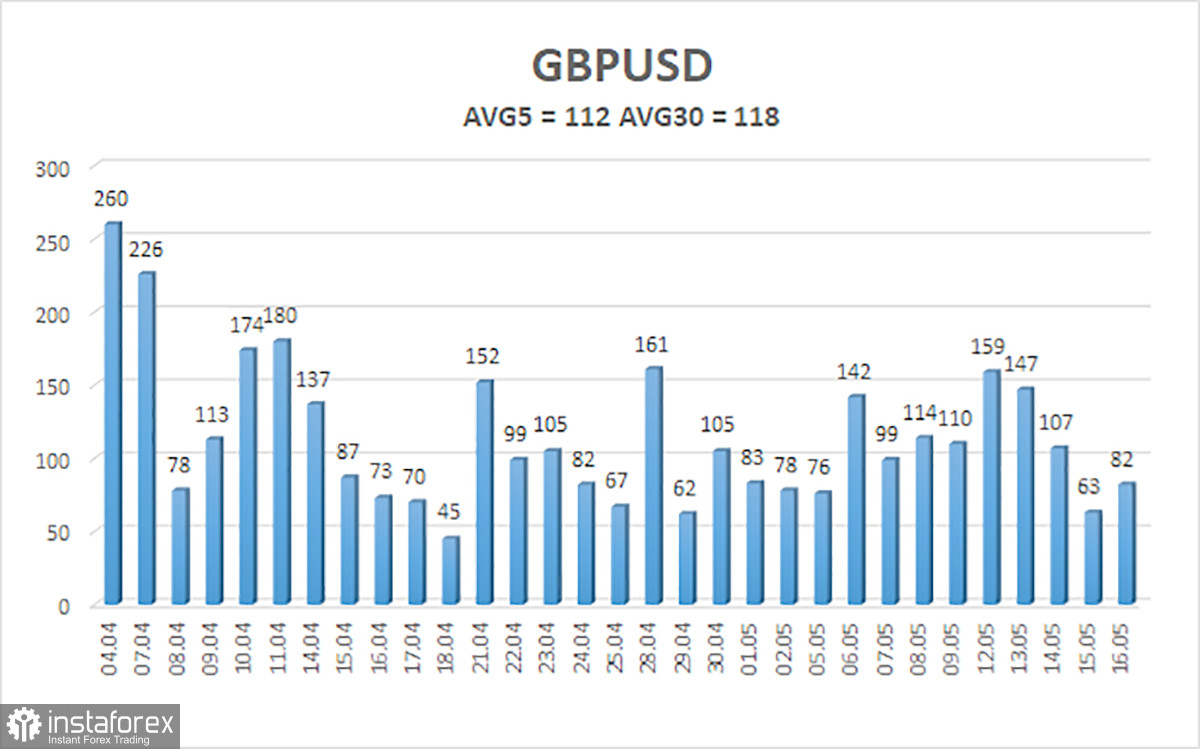
The average volatility for GBP/USD over the last five trading days stands at 112 pips, which is considered "high." Therefore, on Monday, May 19, we expect the pair to move within the range of 1.3165–1.3389. The long-term regression channel points upward, indicating a clear upward trend. The CCI indicator formed a bearish divergence, after which the most recent decline began, though this movement remains sluggish.
Nearest Support Levels:
S1 – 1.3184
S2 – 1.3062
S3 – 1.2939
Nearest Resistance Levels:
R1 – 1.3306
R2 – 1.3428
R3 – 1.3550
Trading Recommendations:
The GBP/USD pair maintains its uptrend and has resumed a correction due to several factors (Fed and BoE policy, trade war de-escalation). We still believe there is no fundamental reason for the pound to grow. If the trade conflict continues to ease (as expected), the dollar could return to the 1.2300–1.2400 range, from where it began to fall during the "Trump phase."
However, given the market's current reluctance to buy dollars, such a move seems unlikely. We believe that long positions are not viable in the context of trade war de-escalation. At the same time, the market is outright rejecting short positions, meaning a strong move south is also out of reach. In the short term, we expect another leg downward toward the targets of 1.3165 and 1.3184—but breaking below those levels will be challenging.
Explanation of Illustrations:
Linear Regression Channels help determine the current trend. If both channels are aligned, it indicates a strong trend.
Moving Average Line (settings: 20,0, smoothed) defines the short-term trend and guides the trading direction.
Murray Levels act as target levels for movements and corrections.
Volatility Levels (red lines) represent the likely price range for the pair over the next 24 hours based on current volatility readings.
CCI Indicator: If it enters the oversold region (below -250) or overbought region (above +250), it signals an impending trend reversal in the opposite direction.