The GBP/USD currency pair traded sideways on Thursday with low volatility—typical behavior for the pound over the past month. First, there was a classic flat range; now, we see "swings" with a slight downward bias. The market seems to say, "I don't want to buy the dollar." A whole month has passed since the pair reached three-year highs, yet the pound continues to hover near those very peaks.
Of course, there's occasionally been some positive news out of the UK. For example, yesterday we learned that the economy grew by 0.7% in Q1. Is that a positive signal? Yes. Over the last three years, the British economy has only shown similar or better growth on two other occasions. But if we look at the annual growth rate, we see that GDP slowed from 1.5% to 1.3% in Q1 2025. Is there much optimism in that, especially when Andrew Bailey forecasts an economic slowdown?
The UK's unemployment rate has risen to 4.5%, business activity is declining, and industrial production hasn't grown for nearly three years. Where's the positive momentum in that? Meanwhile, the U.S. economy is only showing serious issues now, in 2025, since Donald Trump became president. But let's not forget about central bank monetary policy, which has always played a critical role in exchange rate dynamics. The Bank of England has cut its rate twice in three meetings this year; the Fed hasn't cut at all. Isn't that a strong factor in favor of the dollar?
Fine, the market pays no attention to economic conditions, macro data, or overall fundamentals. It only cares about the trade war. But the UK and the U.S. have already agreed on a trade deal. And global trade tensions are easing day by day. Isn't that reason enough for the dollar to appreciate?
We believe that the markets are currently resisting Trump and his policies. Traders are concerned about Trump's potential decisions, fearing that he might make impulsive choices that could lead to significant drops in the stock and bond markets and harm the economy. So even though the dollar has enough reasons to rise against the pound, if traders refuse to buy it—regardless of those reasons—then appreciation just won't happen.
On the weekly time frame, the pound has been rising since September 2022. Yet over that period, its gains are still smaller than its decline during the last leg of the 16-year downtrend, which lasted just over a year. This suggests that we are still in a corrective phase in the long term. Accordingly, there's no reason to believe the long-term dollar trend is over, or that the pair will rise for several years.
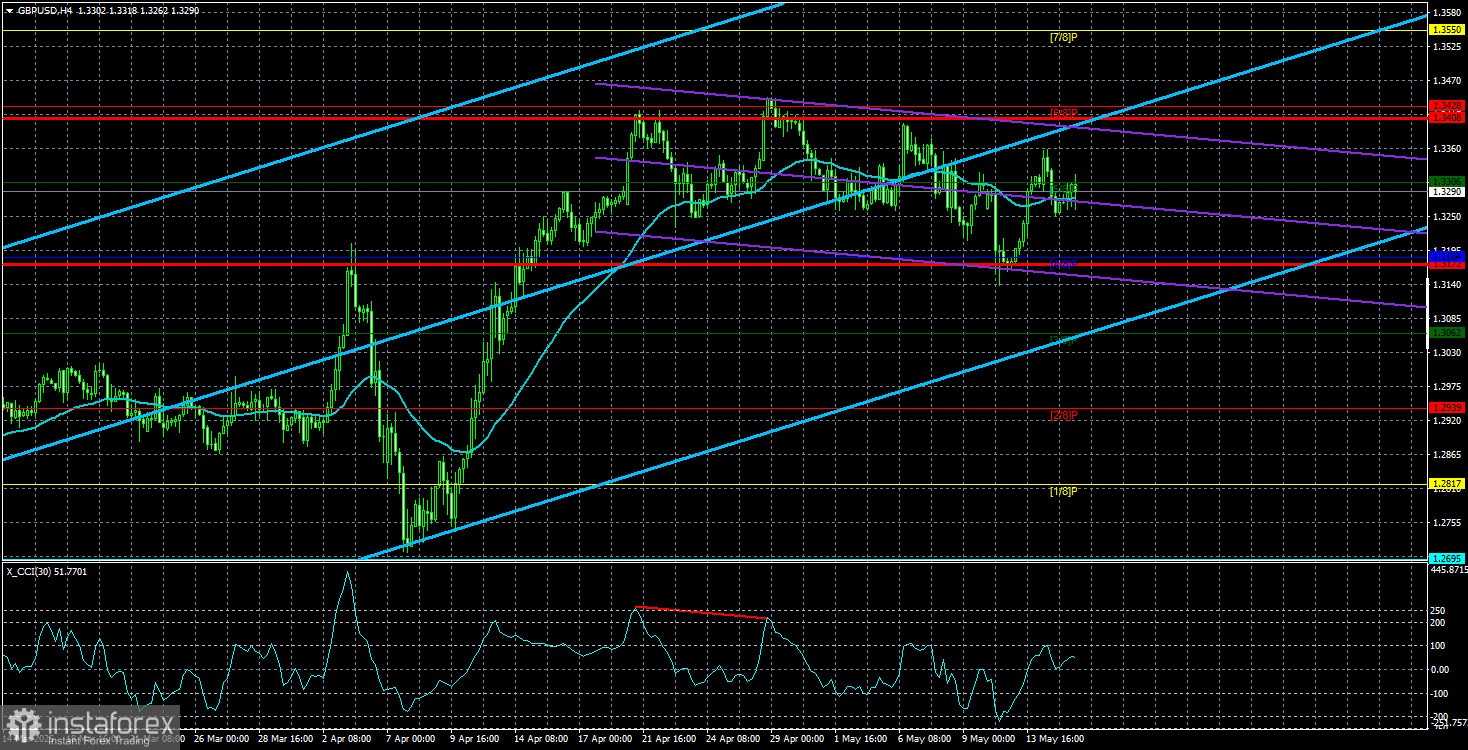
The average volatility for GBP/USD over the last five trading days stands at 118 pips, which is considered high. On Friday, May 16, we expect movement within the range bounded by 1.3172 and 1.3408. The long-term regression channel remains upward, indicating a clear upward trend. The CCI indicator has formed a bearish divergence, which triggered the latest pullback.
Nearest Support Levels:
S1 – 1.3184
S2 – 1.3062
S3 – 1.2939
Nearest Resistance Levels:
R1 – 1.3306
R2 – 1.3428
R3 – 1.3550
Trading Recommendations:
The GBP/USD pair remains in an upward trend and has resumed its correction, thanks to trade agreements between China and the U.S. However, we still believe the pound has no fundamental grounds to grow. If trade tensions continue to ease—as they appear—the dollar could return to the 1.2300–1.2400 range, where its decline "under Trump" began. With the market's current unwillingness to buy the dollar, it's hard to believe such a move is imminent. In our view, long positions are not relevant in the current context of trade de-escalation. Sell orders remain attractive. Initial targets are 1.3184 and 1.3172, provided the price remains below the moving average.
Explanation of Illustrations:
Linear Regression Channels help determine the current trend. If both channels are aligned, it indicates a strong trend.
Moving Average Line (settings: 20,0, smoothed) defines the short-term trend and guides the trading direction.
Murray Levels act as target levels for movements and corrections.
Volatility Levels (red lines) represent the likely price range for the pair over the next 24 hours based on current volatility readings.
CCI Indicator: If it enters the oversold region (below -250) or overbought region (above +250), it signals an impending trend reversal in the opposite direction.