EUR/USD
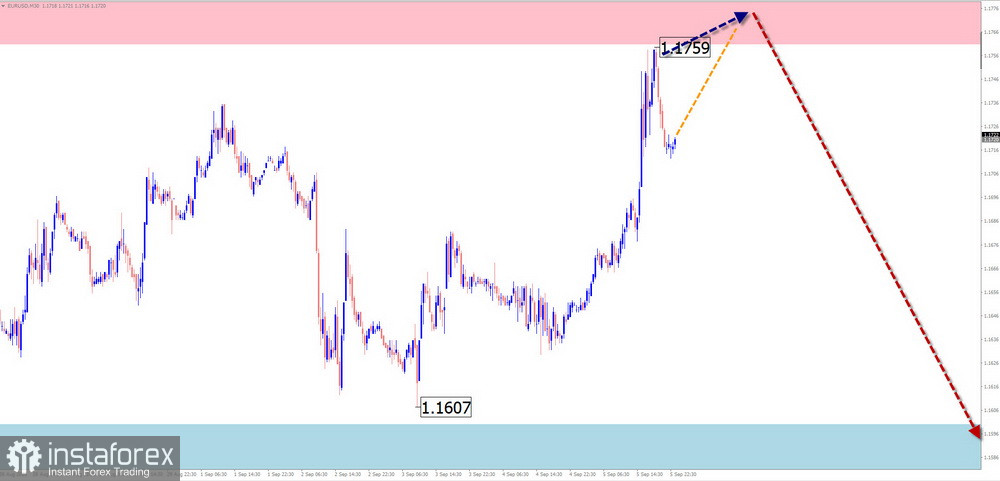
Brief analysis:The 4-hour chart of the common European currency major shows that since February this year, the trend has been driven by an upward wave. The unfinished segment of the main trend started on July 31. Over the past two weeks, a counter correction has formed, in the shape of a contracting flat. The price is moving along the lower boundary of a strong potential reversal zone.
Weekly forecast:In the coming days, the euro is likely to maintain a sideways bias with an overall upward vector. A stop, reversal, and subsequent decline should be expected near the resistance zone. The support level marks the lower boundary of the expected weekly range.
Potential reversal zones
- Resistance: 1.1760/1.1810
- Support: 1.1600/1.1550
Recommendations
- Sales: after confirmed reversal signals appear near resistance.
- Purchases: may be used in small lots within intraday trading.
USD/JPY
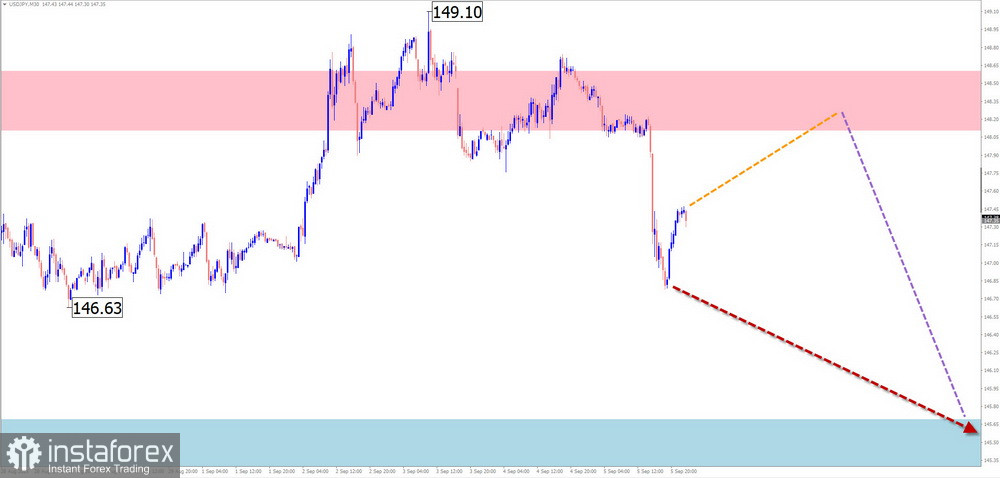
Brief analysis:The downward section of the Japanese yen major from August 1 completes the prolonged bullish wave since April. Once confirmed, it will start a new phase of the earlier dominant bearish trend. The price is moving along the lower boundary of a strong potential reversal zone. Before further decline, the pair needs to complete the correction of the past month.
Weekly forecast:Sideways movement is expected in the coming days, with price moving along resistance levels. A breakout above resistance is unlikely. The second half of the week is expected to be more volatile. From the resistance zone, a decline toward support levels is expected.
Potential reversal zones
- Resistance: 148.10/148.60
- Support: 145.70/145.20
Recommendations
- Purchases: risky, with limited potential.
- Sales: could be profitable after reversal signals near resistance.
GBP/JPY
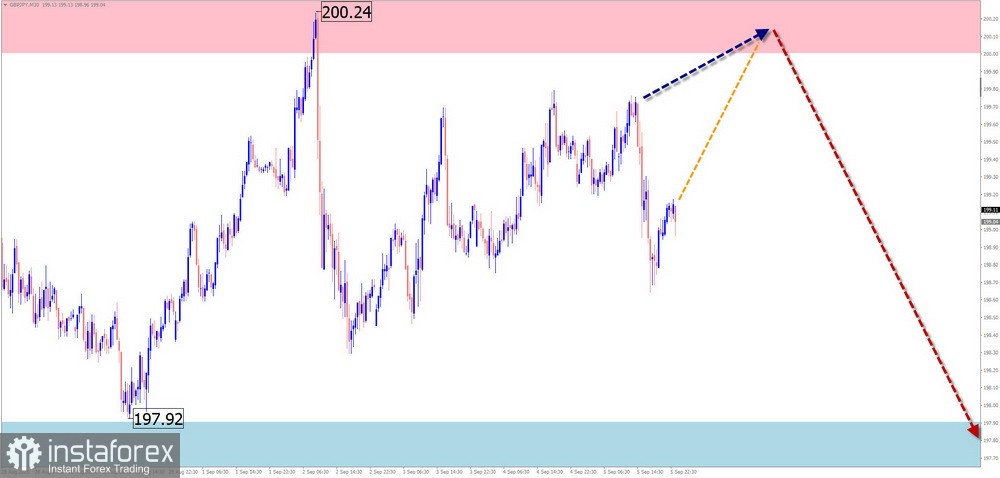
Brief analysis:On a larger scale, the GBP/JPY pair has been in an uptrend for the past six months. From the lower boundary of strong resistance, after a corrective decline since August 4, an upward wave with reversal potential is developing. Its middle part (B) is close to completion. No early reversal signals are visible yet.
Weekly forecast:Early in the week, the pair is likely to maintain a sideways trajectory along the resistance zone. Toward the weekend, the probability of higher volatility and a reversal to the downside increases. A brief breakout of the upper boundary cannot be ruled out. The timing of the reversal may coincide with key economic data releases.
Potential reversal zones
- Resistance: 200.00/200.50
- Support: 197.90/197.40
Recommendations
- Purchases: carry high risk and may lead to losses.
- Sales: can be considered after reversal signals near support.
USD/CAD
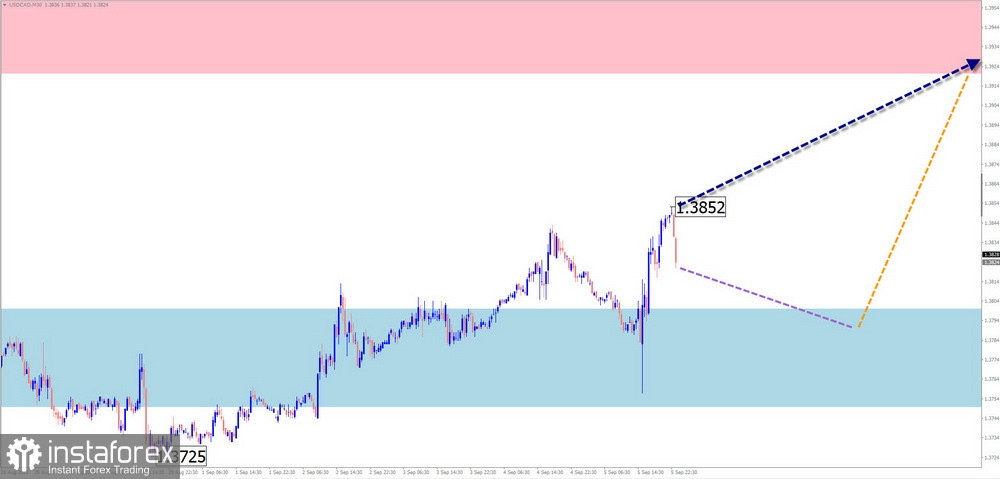
Brief analysis:For the past six months, the Canadian dollar has been moving downward against the U.S. dollar. Over the last three months, the price has been forming a flat correction. The wave structure lacks a final segment.
Weekly forecast:Sideways movement is expected at the start of the week, possibly with a decline toward the support zone. A reversal and subsequent rise toward resistance may follow. Volatility is likely to increase closer to the weekend.
Potential reversal zones
- Resistance: 1.3920/1.3970
- Support: 1.3800/1.3750
Recommendations
- Sales: limited potential, suitable for intraday trades in small volumes.
- Purchases: conditions will appear only after confirmed reversal signals near support.
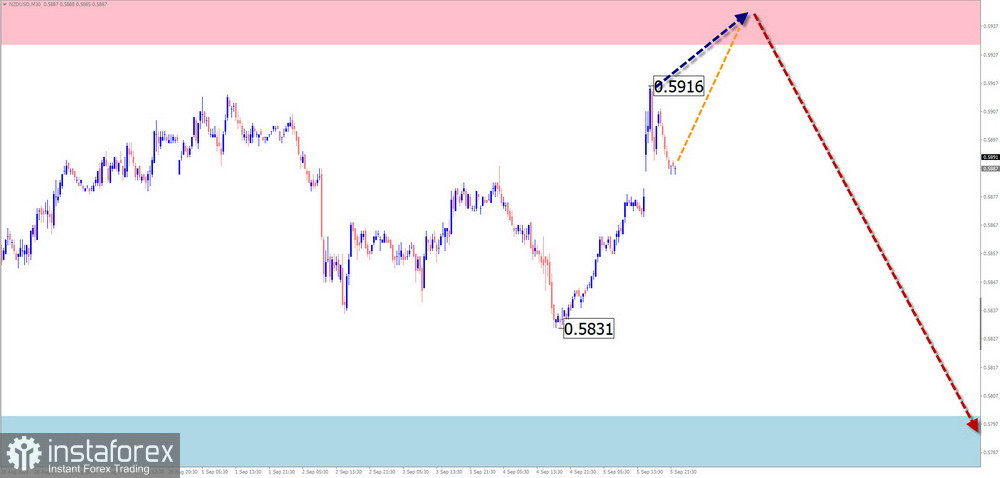
NZD/USD
Brief analysis:Since early July, the "kiwi" has been moving downward. On higher timeframes, this section forms a correction, not yet complete. The last unfinished upward segment started on July 29. The pair is currently locked in a narrow corridor between opposing zones.
Weekly forecast:In the first days, the bullish bias may continue, with growth toward resistance. A reversal can be expected in the second half of the week. Renewed bullish movement may coincide with important economic releases. The support zone marks the lower boundary of the expected weekly range.
Potential reversal zones
- Resistance: 0.5930/0.5980
- Support: 0.5800/0.5750
Recommendations
- Purchases: no conditions at present.
- Sales: recommended after confirmed reversal signals near resistance.
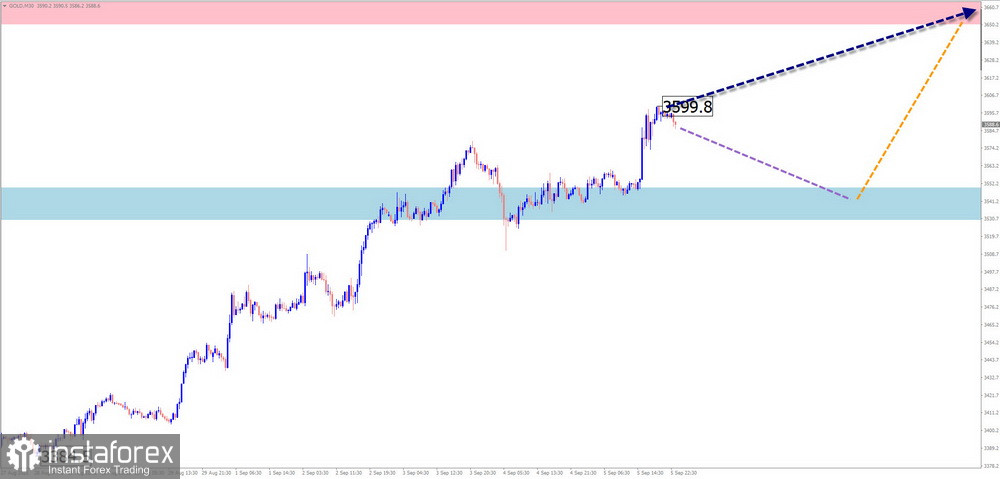
Gold
Brief analysis:Gold has maintained a weak upward bias for the past six months, mainly trading sideways, forming a correction to the prior uptrend. Currently, the structure resembles a contracting flat, still lacking a final segment. In recent weeks, the price broke through resistance, gaining room to move higher.
Weekly forecast:Early in the week, gold is likely to trade more sideways, with possible declines toward support. Conditions for a reversal and renewed growth may form afterward. The resistance zone marks the upper boundary of the expected weekly range.
Potential reversal zones
- Resistance: 3650.0/3670.0
- Support: 3550.0/3530.0
Recommendations
- Sales: high risk, safer if using small volumes.
- Purchases: relevant after confirmed reversal signals near support.
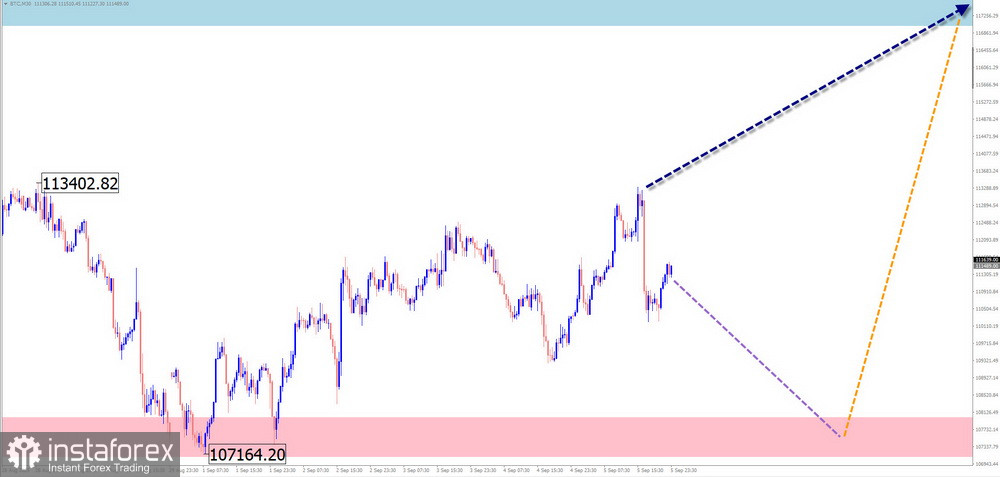
Bitcoin (#BTC)
Brief analysis:Since early August, Bitcoin's short-term trend has been guided by an upward wave. The last two weeks have seen an unfinished downward section of this wave. The price is nearing the upper boundary of the potential daily reversal zone.
Weekly forecast: A continuation of the downward vector is most likely in the coming days, up to support zone levels. A reversal is highly probable afterward. Growth can be expected at the end of this week or the beginning of the next.
Potential reversal zones
- Resistance: 117000.0/118000.0
- Support: 108000.0/109000.0
Recommendations
- Sales: possible in small volumes during separate sessions, with potential limited to the support zone.
- Purchases: become relevant after reversal signals near support.
Notes: In simplified wave analysis (SWA), all waves consist of three parts (A-B-C). On each timeframe, the analysis focuses on the last unfinished wave. Expected movements are shown with dashed lines.
Attention: The wave algorithm does not account for the time duration of price movements!