The GBP/USD currency pair also continued its upward movement, which did not require any new fundamental events or macroeconomic releases. Tuesday's U.S. inflation report was more than enough. Recall that headline inflation remained unchanged for the second month of summer, while core inflation accelerated slightly more than forecast. So why have we seen the U.S. currency fall for two days in a row?
First, because we have been seeing the dollar decline for the seventh month in a row, we have listed the reasons countless times, and they have not changed recently.
Second, because low inflation encourages repeated monetary policy easing by the Federal Reserve, the labor market has shown discouraging results over the last three months, while inflation remains relatively low. What follows from this? The Fed may cut rates several times before the end of the year — in fact, three times.
Third, Donald Trump is winning against Jerome Powell in their forecasts. It was the U.S. president who consistently stated that tariffs would not cause inflation to rise, while the Fed Chair took the opposite view. Frankly, we still believe Powell is correct, as higher prices for many imported goods and goods that use imported raw materials in production cannot fail to provoke a general rise in prices. At the same time, we acknowledge that, for now, inflation is indeed growing very slowly.
Let us remind traders of the main equation. If the dollar fell like a stone into an abyss in the first half of 2025, when the Fed maintained a hawkish stance and did not cut the key rate even once, then what can be expected from it in the second half of 2025, when the Bank of England and the European Central Bank remain silent, but the Fed will have to ease monetary policy? Especially if the trade war continues in its current form.
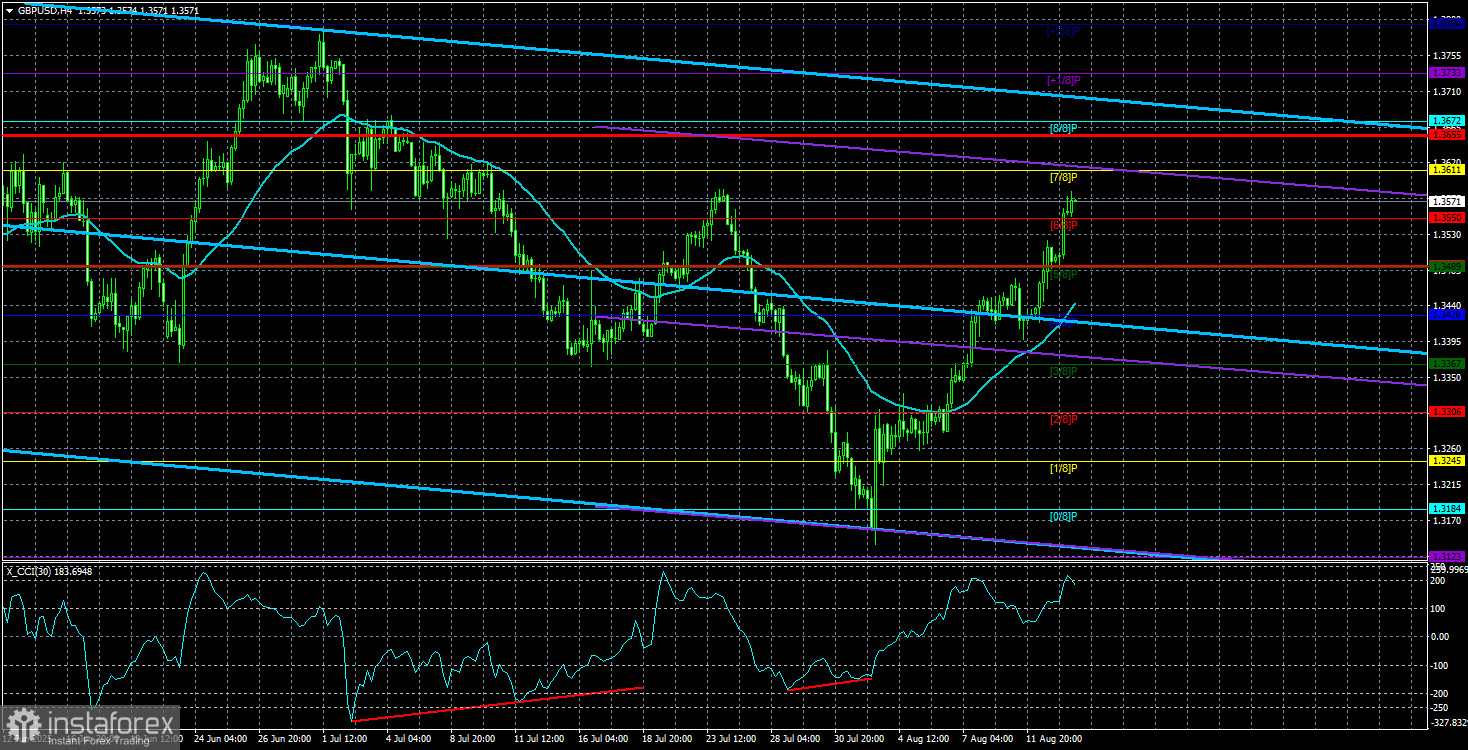
On the daily timeframe, GBP/USD has perfectly corrected to the Senkou Span B line and the 38.2% Fibonacci level. From these supports, there was a clear rebound, which marked the start of a new upward leg. Therefore, the fundamental background supports growth by about 90%. Technical analysis also supports growth. As a result, the dollar's decline is entirely logical.
And most likely, its fall will continue because no one in the White House wants a "strong dollar." The U.S. currency is still "strong" even now. Recall that over the past 17 years, the dollar has only strengthened on the currency market. Thus, a six-month decline can hardly be seen as bringing the dollar to a fair and balanced exchange rate. In our opinion, a global upward trend on the monthly timeframe may have begun this year. In simpler terms, over the next 5–10 years at a minimum, the dollar is likely to fall. In principle, Trump's policies strongly support this, and the U.S. president has no intention of changing course for now.
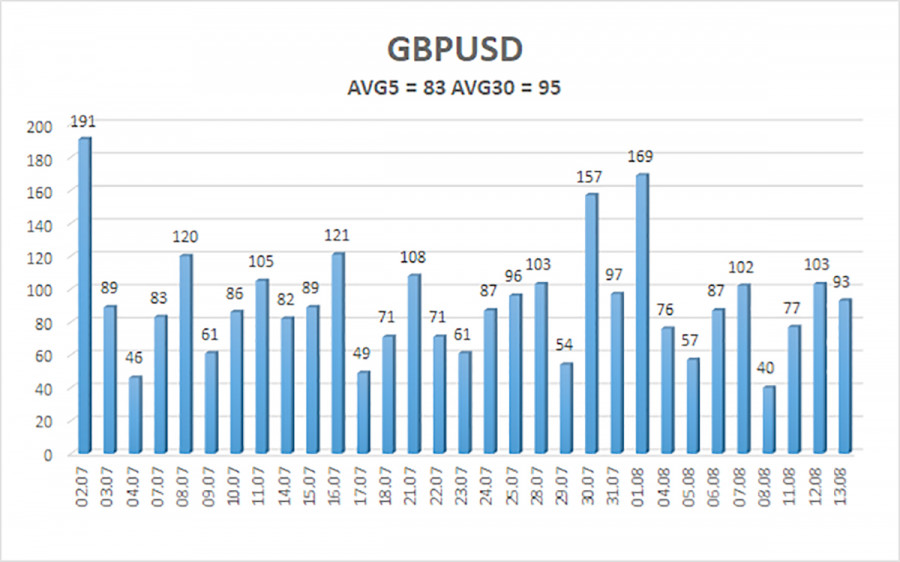
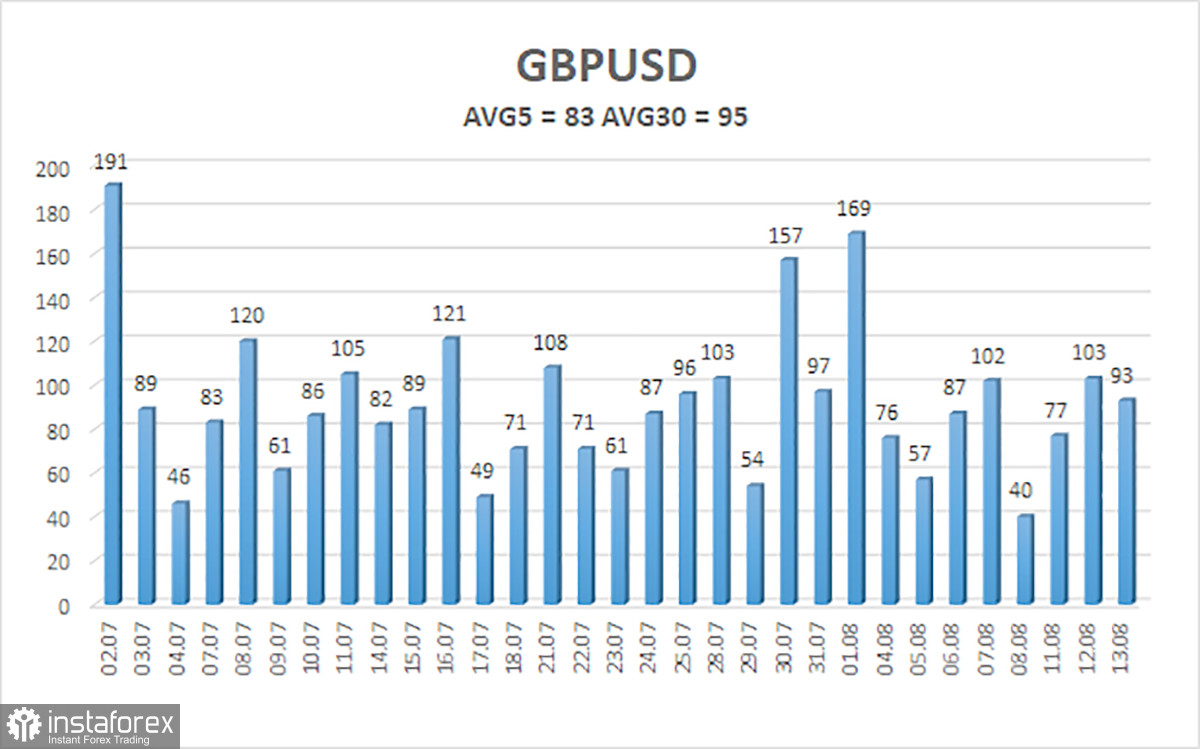
The average volatility of the GBP/USD pair over the past five trading days is 83 pips. For the pound/dollar pair, this value is considered "moderate." Therefore, on Thursday, August 14, we expect movement within the range bounded by the levels of 1.3490 and 1.3655. The long-term linear regression channel is pointing upward, indicating a clear upward trend. The CCI indicator has entered oversold territory twice, signaling the resumption of the uptrend. Several bullish divergences also formed before the rise began.
Nearest Support Levels:
S1 – 1.3550
S2 – 1.3489
S3 – 1.3428
Nearest Resistance Levels:
R1 – 1.3611
R2 – 1.3672
R3 – 1.3733
Trading Recommendations:
The GBP/USD currency pair has completed another round of downward correction. In the medium term, Trump's policies are likely to continue pressuring the dollar. Therefore, long positions with targets at 1.3611 and 1.3655 remain much more relevant if the price is above the moving average. If the price is below the moving average, small short positions with targets at 1.3367 and 1.3306 can be considered on purely technical grounds. From time to time, the U.S. currency shows corrections, but for a trend-based strengthening, it would need real signs of the end of the global trade war, which is likely no longer possible.
Explanation of Illustrations:
Linear Regression Channels help determine the current trend. If both channels are aligned, it indicates a strong trend.
Moving Average Line (settings: 20,0, smoothed) defines the short-term trend and guides the trading direction.
Murray Levels act as target levels for movements and corrections.
Volatility Levels (red lines) represent the likely price range for the pair over the next 24 hours based on current volatility readings.
CCI Indicator: If it enters the oversold region (below -250) or overbought region (above +250), it signals an impending trend reversal in the opposite direction.