GBP/USD 5-Minute Analysis
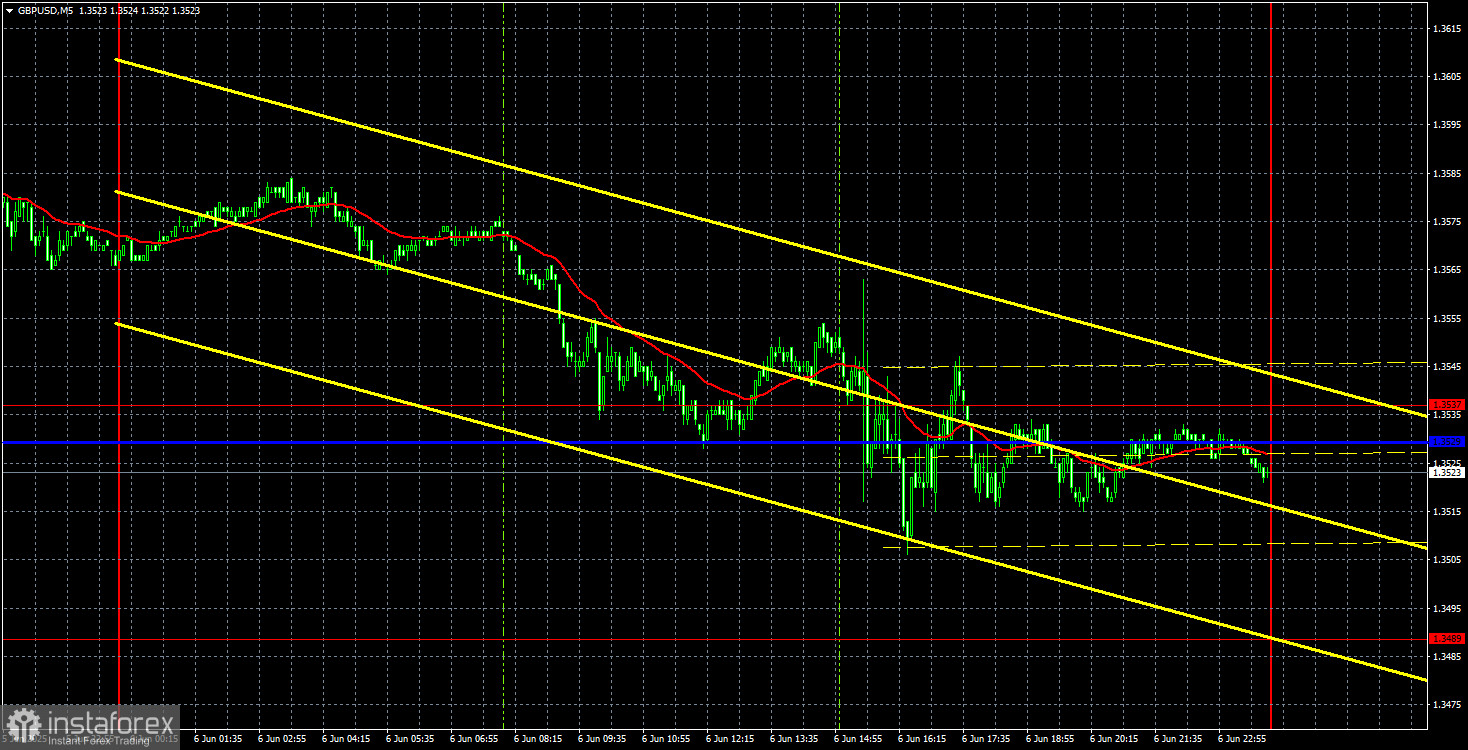
On Friday, the GBP/USD currency pair was trading lower, and since the trendline was very close to the price, even a minimal decline was enough to break through it. Recall that 10 days ago, the pound sterling showed signs of shifting to a downtrend. The price exited the upward channel at that time, but a decline (meaning U.S. dollar growth) did not follow. This is not surprising, as the market continues to closely monitor all news related to Donald Trump and the trade war, while many other data points are simply ignored. Positive news about Trump and the trade war is quite rare, which usually leads to a decline in the U.S. dollar.
On Friday, the NonFarm Payrolls and unemployment rate reports showed decent but not strong figures. The dollar received some support, but it was weak. It's also worth noting that such reports released on Friday are more an exception than the rule. We wouldn't have been surprised if the market had not reacted to the data. Thus, the dollar might continue to grow for another day or two (perhaps up to the Senkou Span B line). Elon Musk may launch a full-scale campaign against Trump, creating real chances for the current president to be removed. In that case, the U.S. dollar might experience stronger growth as the market would anticipate a change in leadership and an end to the trade war. But for now, counting on something like that is difficult.
In the 5-minute timeframe, Friday's movements were so chaotic that we didn't even mark trading signals — they were all false. Just look at the pair's intraday movements — constant pullbacks and reversals. It seemed the market didn't want to buy the dollar but was forced to. Thus, the overall technical picture remains the same: if the dollar grows, it's slow, difficult, and short-lived.
COT Report
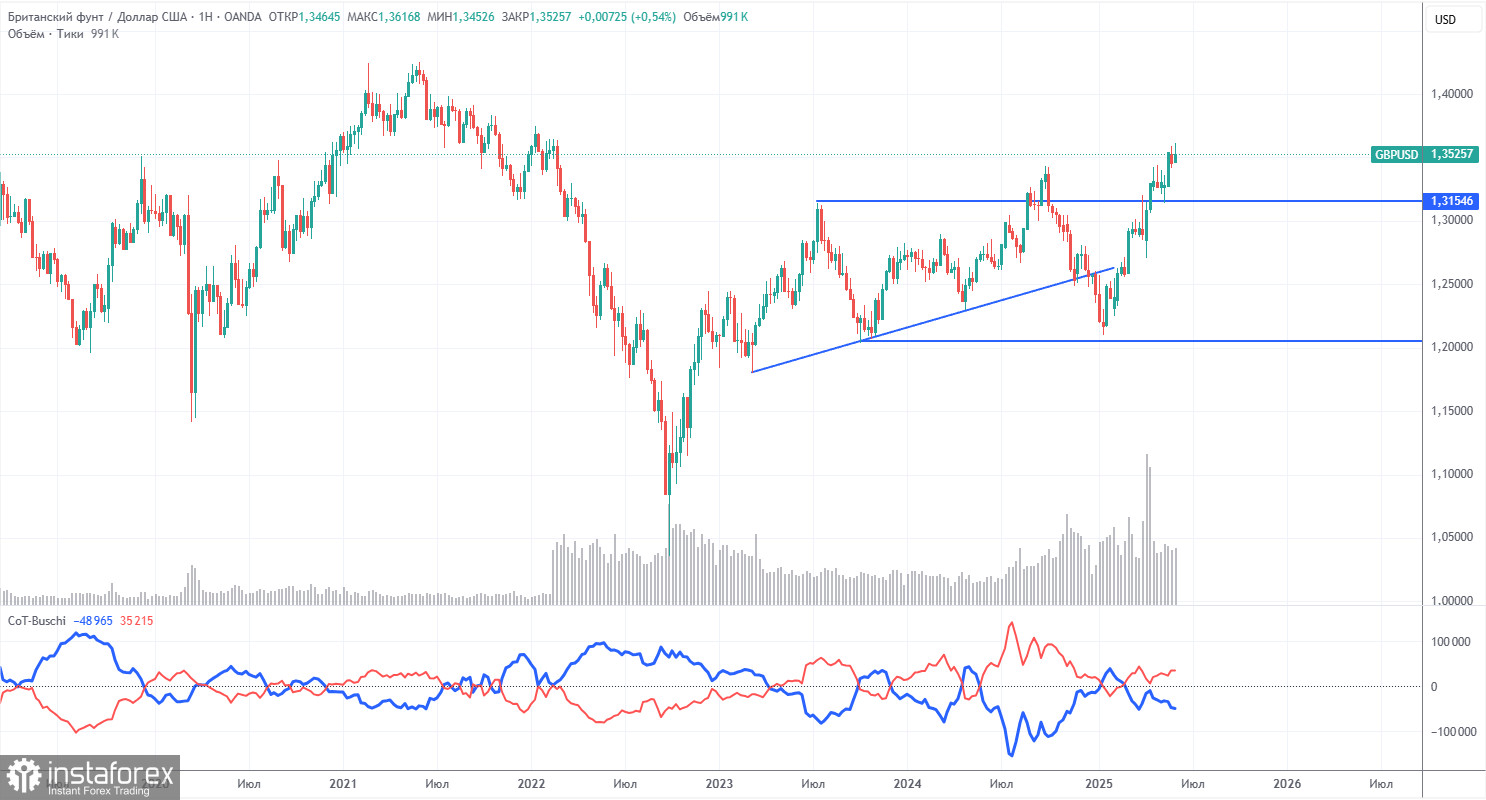
The COT reports for the British pound show that commercial traders' sentiment has constantly changed in recent years. The red and blue lines, representing the net positions of commercial and non-commercial traders, constantly cross and are usually near the zero mark. They are currently close to each other, indicating a roughly equal number of buy and sell positions. However, the net position has been increasing over the last year and a half.
The dollar continues to fall due to Donald Trump's policies, so market makers' demand for the pound sterling is not very important at the moment. If de-escalation of the global trade war resumes, the U.S. dollar will have a chance for some strengthening. According to the latest COT report on the pound, the "Non-commercial" group opened 1,300 BUY contracts and 1,400 SELL contracts. Thus, the net position of non-commercial traders barely changed for the reporting week.
Recently, the pound has risen significantly, but it's important to note that there's only one reason: Trump's policy. Once that factor is neutralized, the dollar could rise, but no one knows when that will happen. The pound itself has no fundamental reasons for growth. Nevertheless, traders are more than satisfied with the "Trump factor" when making trading decisions.
GBP/USD 1-Hour Analysis
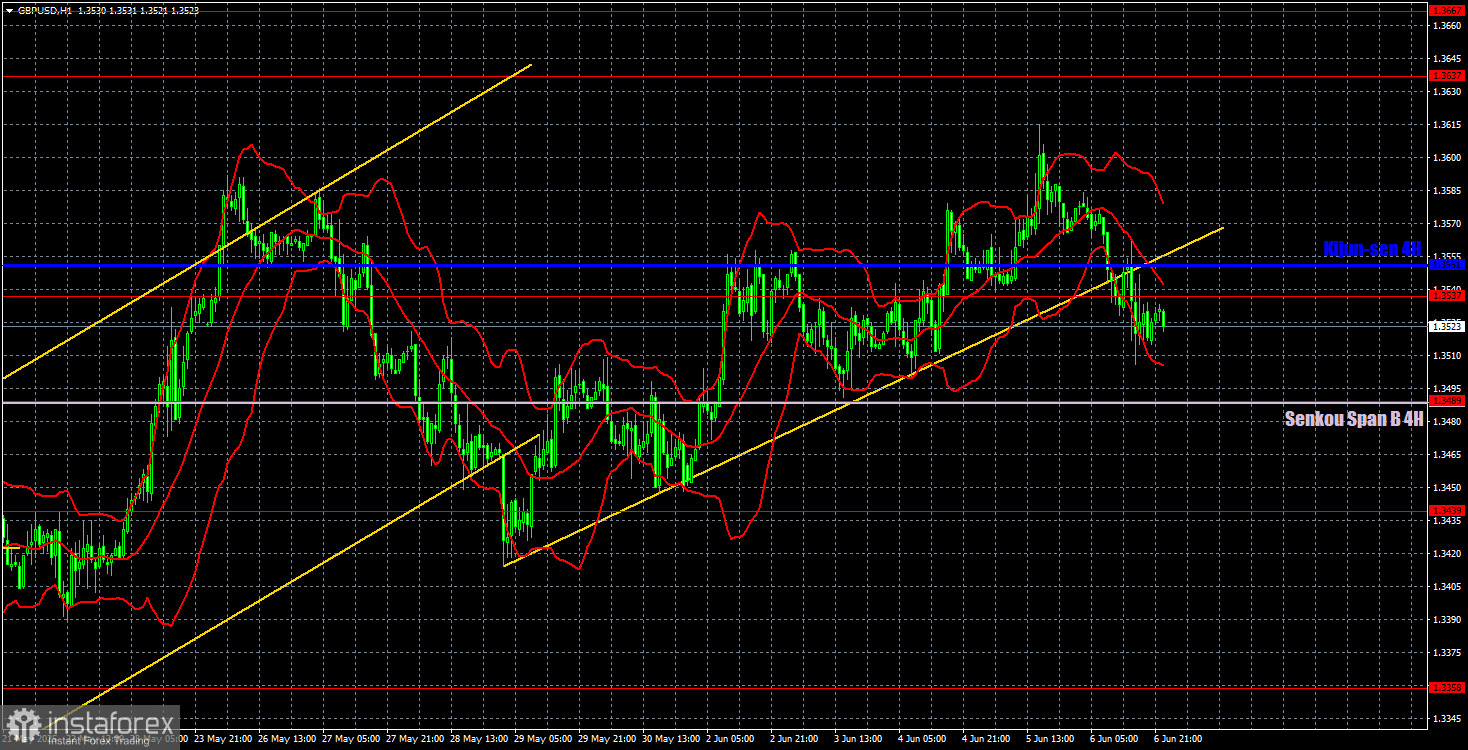
The GBP/USD pair maintains its upward trend in the hourly timeframe despite breaking below the ascending channel. The pair's further movement entirely depends on Trump and the global trade war situation, not on technical analysis. The overall sentiment and attitude toward America and its president's policies remain sharply negative, making it hard for the dollar to expect strong growth. Trump regularly upsets the market with new measures, tariffs, and scandals, while U.S. macroeconomic data often disappoint rather than please.
For June 9, we highlight the following important levels: 1.2981–1.2987, 1.3050, 1.3125, 1.3212, 1.3288, 1.3358, 1.3439, 1.3489, 1.3537, 1.3637–1.3667, and 1.3741. The Senkou Span B (1.3489) and Kijun-sen (1.3551) lines may also provide signals. It is recommended to set the Stop Loss at breakeven once the price moves 20 pips in the correct direction. The Ichimoku indicator lines may move during the day, so this should be considered when identifying trading signals.
No crucial events or reports are scheduled for Monday in the UK or the U.S. Thus, we can expect weak, chaotic, or sideways movements throughout the day. Only news directly from the White House should be monitored.
Illustration Explanations:
- Support and resistance price levels – thick red lines where movement may end. They are not trading signal sources.
- Kijun-sen and Senkou Span B lines—These are strong Ichimoku indicator lines transferred to the hourly timeframe from the 4-hour one.
- Extremum levels – thin red lines where the price has previously rebounded. These act as trading signal sources.
- Yellow lines – trend lines, trend channels, and other technical patterns.
- COT Indicator 1 on the charts – the size of the net position for each category of traders.