On Thursday, the GBP/USD currency pair traded relatively calmly, but like EUR/USD, it has been rising for two weeks. At first glance, one might wonder what reasons traders have for such behavior. Seemingly, none. In the EUR/USD article, we listed several reasons behind the dollar's latest decline, but there may be many more. Take, for instance, the key market issue of Donald Trump's trade tariffs. Initially, we saw the implementation of all possible tariffs, followed by a small rollback in tariff rates. In essence, Trump caused damage first, then offered a minor discount. More and more experts are saying that negotiations with the U.S. are like negotiating at gunpoint — and they're right.
From the beginning, we've said that negotiations and ultimatums with threats are different things. The White House may speak of talks and a broken global trade architecture in need of reform, but in practice, the U.S. uses the leverage of its large domestic market to issue ultimatums: either pay more or face tariffs and sanctions. Washington threatens other nations, but American consumers end up paying for the tariffs as the prices of many familiar goods rise.
But enough of the rhetoric — let's return to the topic of negotiations. Two weeks ago, the market was swept by a wave of optimism. Preliminary discussions were held in Geneva about upcoming U.S.-China negotiations, which led to a 115% tariff reduction. Many assumed a trade deal was just weeks away since most duties were already rolled back. However, in practice, Washington and Beijing merely took a necessary step. If tariffs had remained above 100%, trade between the world's two largest economies would have been completely halted or severely constrained.
Who benefits from this? Sure, some companies could find alternative markets or use third-party countries for exports to the U.S., but these are just workarounds. Beijing and Washington agreed on tariffs that ultimately just raise prices for consumers, and essentially, that's where negotiations ended. China still refuses to yield to Trump's pressure, and Trump has no intention of offering concessions or even appearing genuinely interested in talks.
The same applies to U.S.–EU talks — they simply don't exist. From time to time, media outlets report scattered updates suggesting some consultations occur between Washington and Brussels, perhaps via phone calls. But that's not a real negotiation. As for other countries, the situation remains very quiet. Only the U.K. has signed a deal. The other 74 countries are likely still in informal consultations. Globally, the trade war has stopped escalating weekly but has not entered a clear de-escalation phase. In fact, complete de-escalation is impossible since Trump wants better terms for the U.S. that will increase federal revenue. Any deals made will only be under those terms.
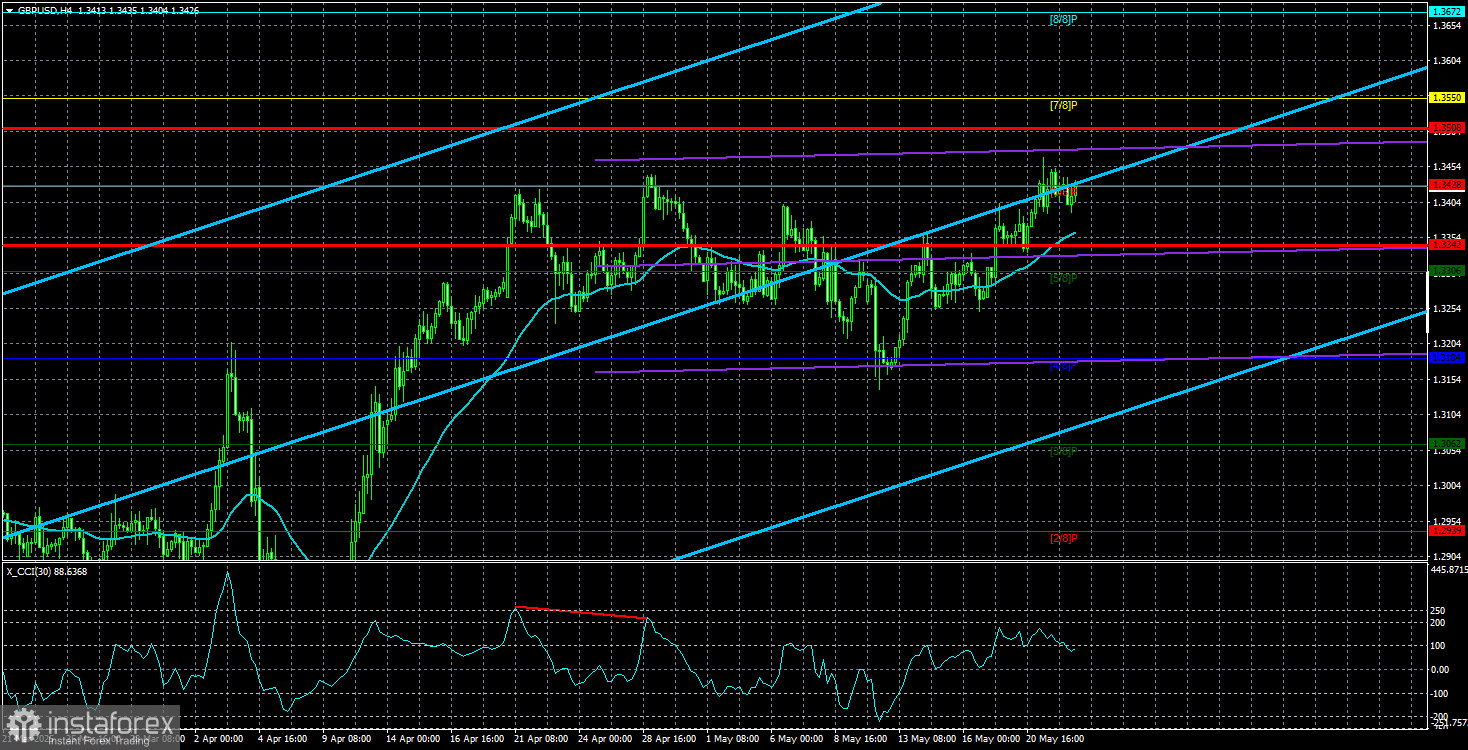
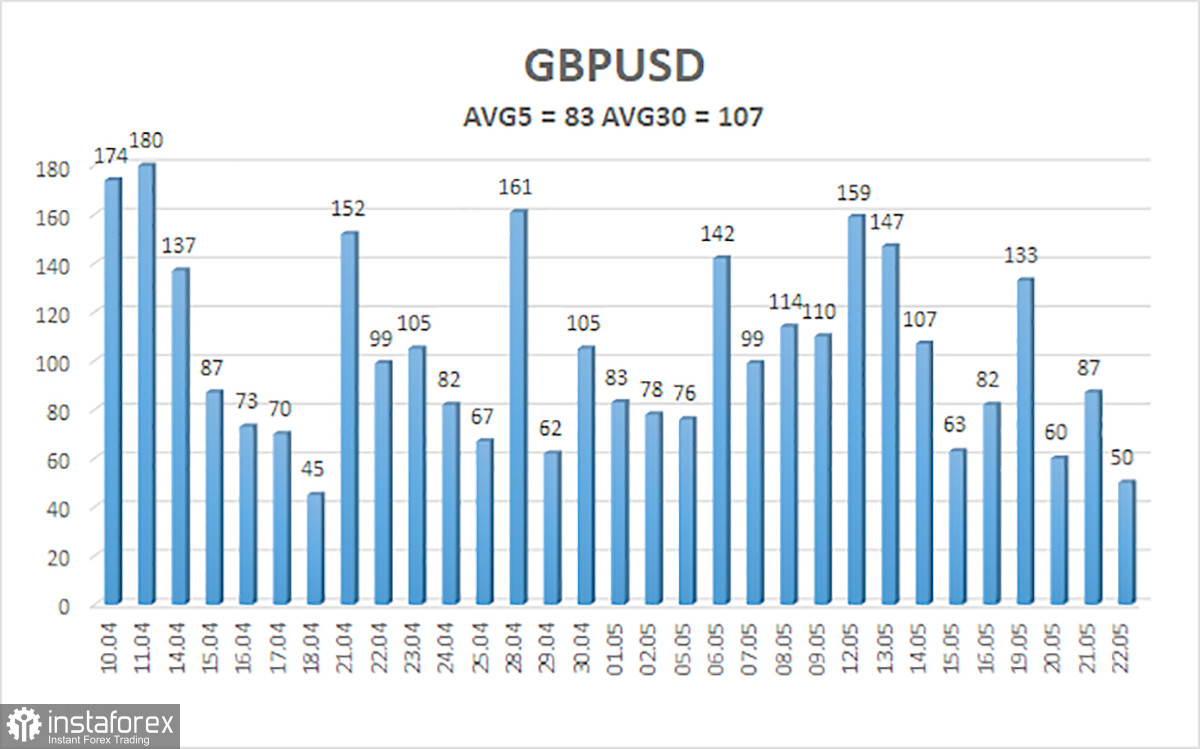
The average volatility of GBP/USD over the past five trading days stands at 83 pips, which is considered moderate for this pair. On Friday, May 23, we expect the pair to trade 1.3342–1.3508. The long-term regression channel is pointing upward, indicating a clear bullish trend. The CCI indicator has not entered extreme zones recently.
Nearest Support Levels:
S1 – 1.3306
S2 – 1.3184
S3 – 1.3062
Nearest Resistance Levels:
R1 – 1.3428
R2 – 1.3550
R3 – 1.3672
Trading Recommendations:
The GBP/USD pair maintains its bullish trend and continues to rise, ignoring all fundamental factors. If the de-escalation of the trade conflict continues — and that appears to be the direction — the dollar might begin to strengthen. However, the market seems driven by a deeply personal aversion to the dollar. We believe that while the trade war is easing, long positions are technically questionable, yet the market refuses to consider shorts. Therefore, long positions remain possible with targets at 1.3508 and 1.3550. If the price consolidates below the moving average line, short positions can be considered with a target of 1.3184.
Explanation of Illustrations:
Linear Regression Channels help determine the current trend. If both channels are aligned, it indicates a strong trend.
Moving Average Line (settings: 20,0, smoothed) defines the short-term trend and guides the trading direction.
Murray Levels act as target levels for movements and corrections.
Volatility Levels (red lines) represent the likely price range for the pair over the next 24 hours based on current volatility readings.
CCI Indicator: If it enters the oversold region (below -250) or overbought region (above +250), it signals an impending trend reversal in the opposite direction.