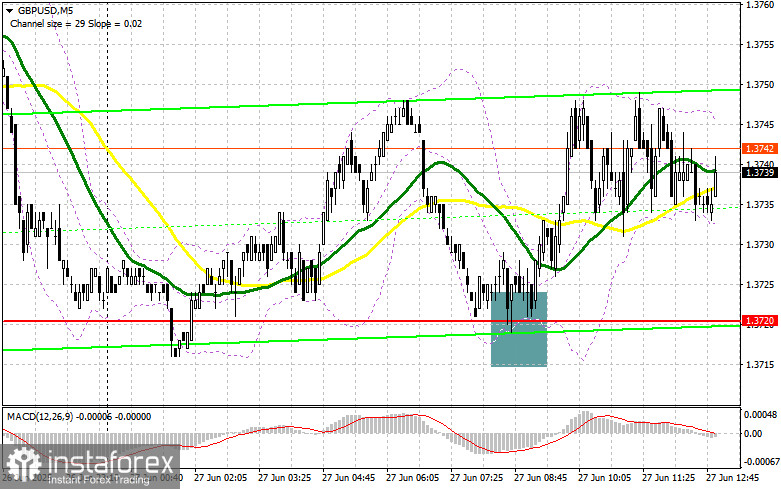
In my morning forecast, I highlighted the 1.3720 level and planned to make trading decisions based on it. Let's take a look at the 5-minute chart and examine what happened. A decline followed by a false breakout at this level provided an excellent entry point for buying the pound, which resulted in a gain of over 30 points. The technical outlook was revised for the second half of the day.
To Open Long Positions on GBP/USD:
As expected, the pound corrected in the first half of the day, but buyers quickly stepped in, keeping the pair within the channel and allowing a continuation of the bullish trend formation. U.S. data on the Core PCE Price Index and changes in personal income and spending will determine the pair's direction later today. It is also worth paying attention to speeches from FOMC members Lisa D. Cook and Beth M. Hammack. While the Fed's position is generally understood, the interviews may still provide new insights.
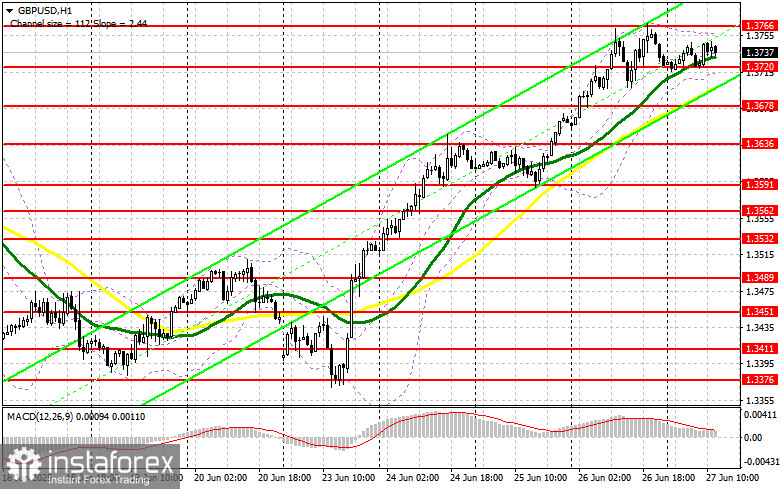
In the event of a decline in GBP/USD, I prefer to act near the 1.3720 support level. A false breakout there, similar to the one discussed earlier, would offer a good entry point into long positions with a target of returning to the 1.3766 resistance level. A breakout and retest of this range from above would serve as confirmation for a new long entry, aiming for a renewal of 1.3818. The furthest target will be the 1.3864 level, where I plan to take profit.
If GBP/USD falls and there is no bullish activity near 1.3720 in the second half of the day, pressure on the pound may increase significantly. In this case, only a false breakout near 1.3678 would be a suitable signal to open long positions. I plan to buy GBP/USD on a bounce from the 1.3636 support area, targeting a 30–35 point intraday correction.
To Open Short Positions on GBP/USD:
Sellers have shown some activity, but to gain an advantage, they need to push the pair below 1.3720. It's also important to defend the monthly high, which could be tested if U.S. data is weak. If GBP/USD continues to rise, only a false breakout near 1.3766 would provide an entry point for short positions targeting a drop to 1.3720. A breakout and retest of this range from below would trigger stop-loss orders and pave the way toward 1.3678, where the moving averages are located. The ultimate target will be the 1.3636 level, where I plan to take profit.
If demand for the pound persists in the second half of the day and bears do not act near 1.3766, a larger GBP/USD surge is possible. In that case, it's better to postpone selling until a test of the 1.3818 resistance level. I will open short positions there only after a failed consolidation. If no downward movement follows, I will look for short entries on a rebound from 1.3864, targeting a 30–35 point downward correction.
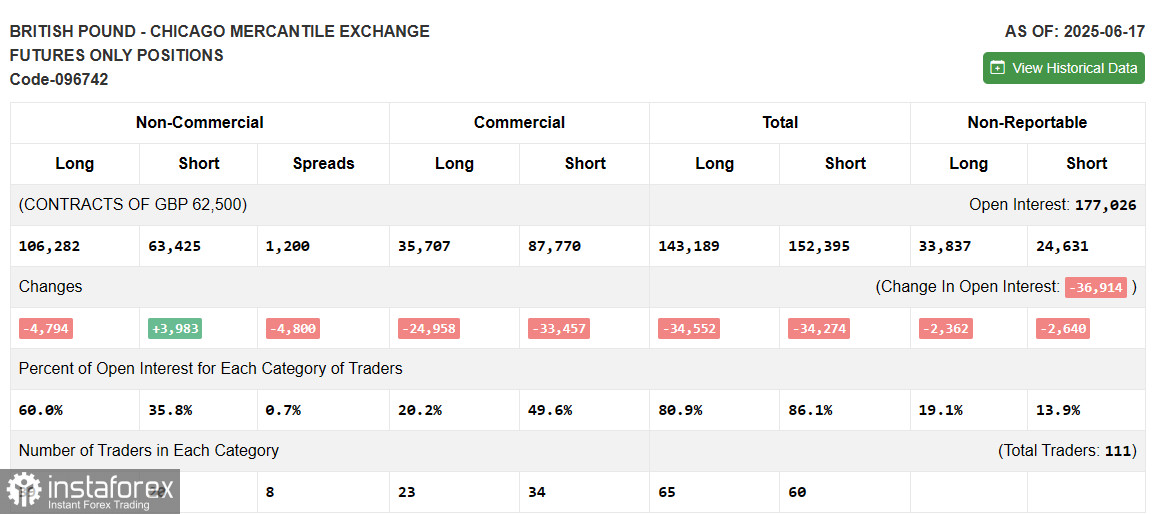
The COT (Commitment of Traders) report for June 17 showed an increase in short positions and a reduction in long positions. The Federal Reserve's decision to keep rates unchanged supported the U.S. dollar, but the key driver remained geopolitical tensions in the Middle East. Upcoming U.S. economic growth data may influence the Fed's next steps. A decisive factor for the dollar's future dynamics will be Jerome Powell's interpretation of the inflation outlook and his views on a possible rate cut in the fall.
The latest COT report shows that long non-commercial positions decreased by 4,794 to 106,282, while short non-commercial positions increased by 3,983 to 63,425. As a result, the net gap between long and short positions narrowed by 4,800.
Indicator Signals:
Moving AveragesTrading is taking place above the 30- and 50-day moving averages, indicating continued pair growth.Note: The author evaluates moving averages on the H1 chart, which differs from classic daily (D1) moving average definitions.
Bollinger BandsIn the event of a decline, the lower band around 1.3590 will act as support.
Indicator Descriptions:
- Moving Average: Smooths volatility and market noise to define the current trend.
- Period 50 – marked in yellow
- Period 30 – marked in green
- MACD (Moving Average Convergence/Divergence):
- Fast EMA – period 12
- Slow EMA – period 26
- Signal line (SMA) – period 9
- Bollinger Bands: Measures price deviation and volatility relative to a moving average. Period – 20
- Non-commercial traders: Speculators such as individual traders, hedge funds, and large institutions using the futures market for speculative purposes.
- Non-commercial long positions: The total speculative long open interest
- Non-commercial short positions: The total speculative short open interest
- Net non-commercial position: The difference between long and short speculative positions.