The EUR/USD currency pair slightly rebounded upward on Friday, and overall, it has been gradually sliding down for several weeks. The movement has been so sluggish that we recently classified it as a flat market. However, at this point on the hourly timeframe, the pair has exited the sideways channel, making it reasonable to refer to this as a downward correction against the three-month uptrend.
Were there reasons for the dollar to strengthen? Yes, and quite a few. The current fundamental backdrop consists primarily of the trade war initiated by Trump—this factor alone outweighs all others, which collectively have no more than a 20% influence on the market. As a result, no matter how good the news from the U.S. may be (if it's unrelated to trade conflict), the dollar struggles to grow.
In recent weeks, we saw a fairly strong NonFarm Payrolls report, a reasonably solid unemployment figure (under the current circumstances), and a decent ISM Business Activity Index. In addition, the Federal Reserve once again left the key interest rate unchanged, and Jerome Powell reiterated that inflation remains the top priority and there's no rush to cut rates. These major macroeconomic indicators and policy actions supported the dollar.
The only disappointment was the Q1 U.S. GDP report, which traders had largely priced in. While no one expected an outright contraction, the result reflected a logical response to Trump's trade policies. Whether the economy slowed or contracted isn't the main concern; the real risk is that continued trade conflict could turn this into a long-term recession. That would be a serious problem for the U.S. economy and the dollar.
It's also worth noting that over the last three weeks, Trump hasn't introduced any new tariffs and now speaks only of upcoming deals and potential tariff reductions for countries that meet U.S. demands. Currently, only one deal has been signed—with the UK. Many experts see this more as a symbolic agreement designed to push other countries to the negotiation table. However, deals with economic heavyweights like China and the EU are what really matter for the dollar and the U.S. economy, and progress there remains lacking.
So yes, the dollar has strengthened in recent weeks, but the market is still reluctant to buy it due to ongoing concerns over Trump. If trade tensions continue to ease, the dollar might gradually recover. But everyone understands that Trump is unpredictable. We wouldn't be surprised if the "first act" of his performance (trade deals) is followed by a "second act" that spells trouble again.
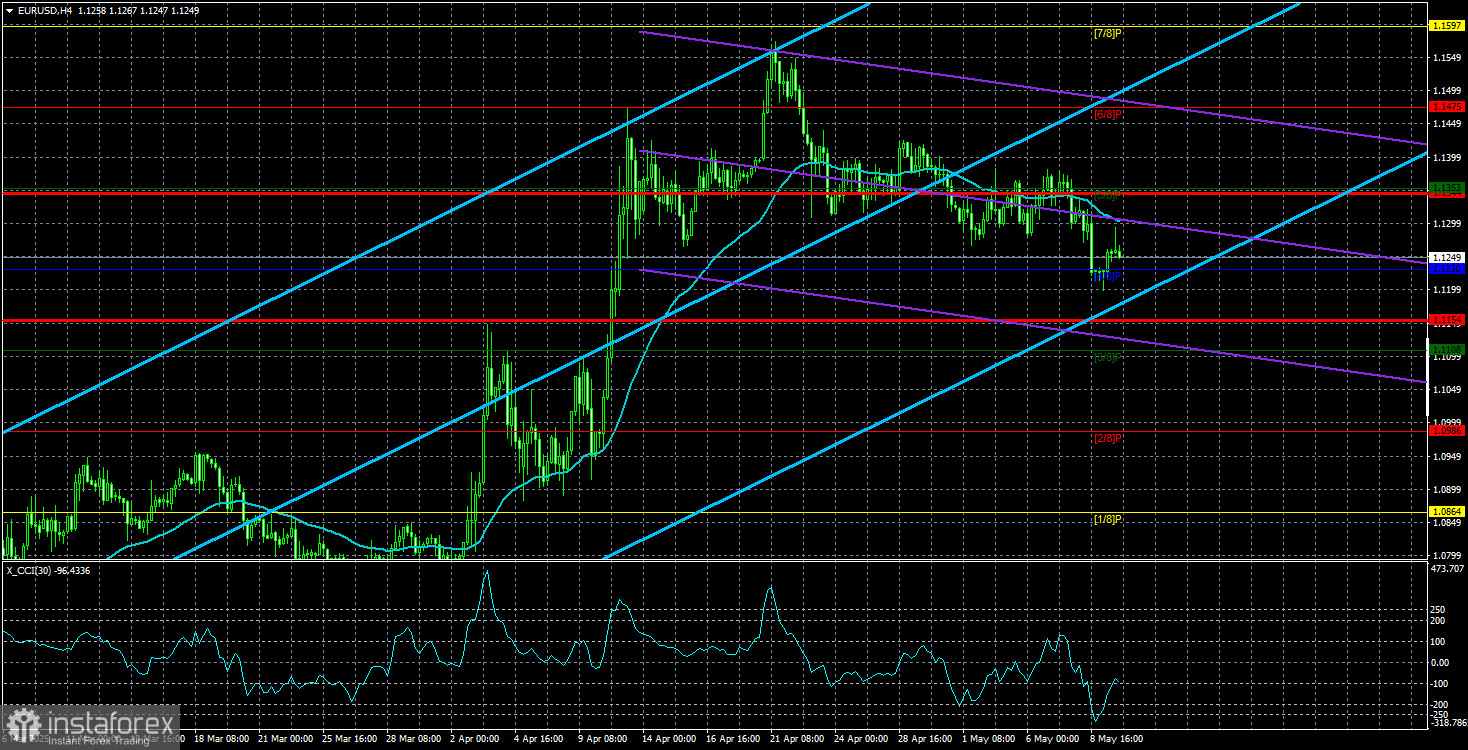
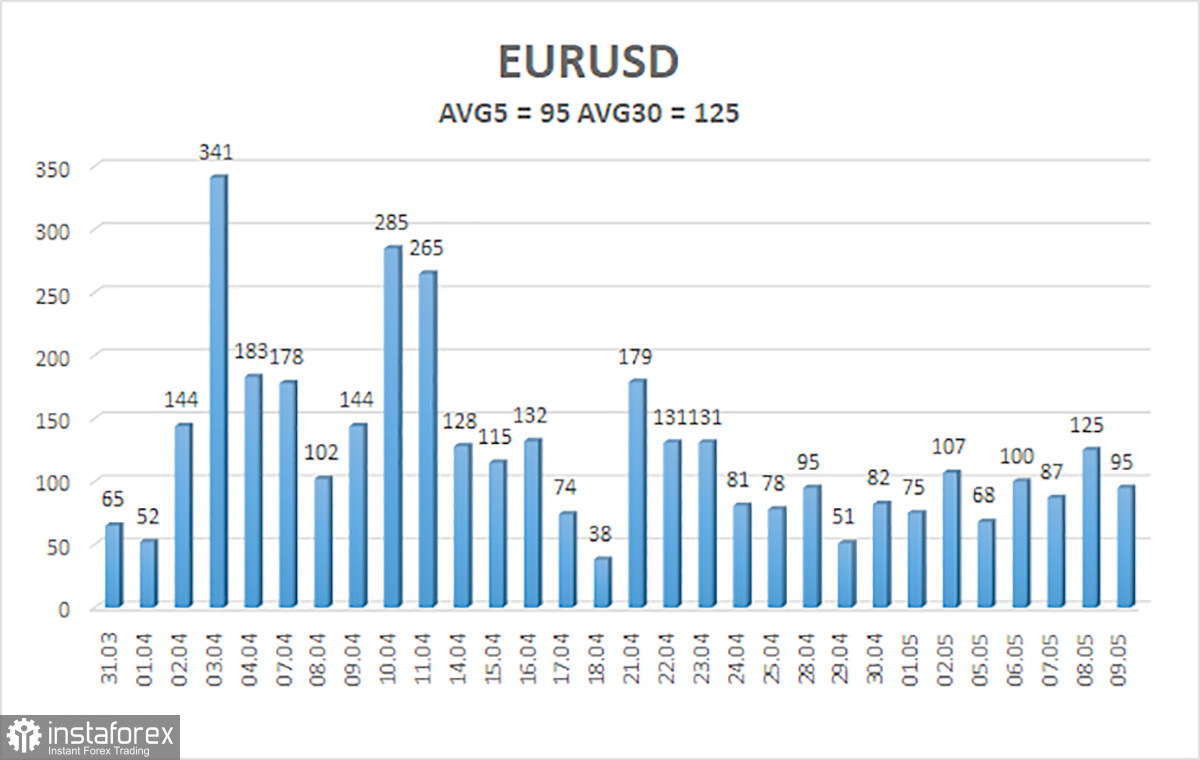
EUR/USD average volatility over the last five trading days as of May 12 is 95 pips, which is considered "average." We expect movement between the levels of 1.1154 and 1.1344 on Monday. The long-term regression channel is still pointing upward, indicating a short-term uptrend. Last week, the CCI indicator entered the oversold zone, which suggests a possible trend continuation during an uptrend.
Nearest Support Levels:
S1 – 1.1230
S2 – 1.1108
S3 – 1.0986
Nearest Resistance Levels:
R1 – 1.1353
R2 – 1.1475
R3 – 1.1597
Trading Recommendations:
EUR/USD has started a new downward correction within the broader uptrend. In recent months, we've consistently stated that we expect only a medium-term decline in the euro, and that view hasn't changed. The dollar still has no reason to fall, except for Donald Trump. However, that one reason continues to push the dollar downward, while the market ignores all other factors.
If you're trading based on "pure technicals" or "Trump," then long positions remain valid as long as the price stays above the moving average, with a target at 1.1475. Short positions are more appropriate if the price is below the moving average, with targets at 1.1129 and 1.1108. The flat trend has ended, but a strong rally in the dollar still isn't expected.
Explanation of Illustrations:
Linear Regression Channels help determine the current trend. If both channels are aligned, it indicates a strong trend.
Moving Average Line (settings: 20,0, smoothed) defines the short-term trend and guides the trading direction.
Murray Levels act as target levels for movements and corrections.
Volatility Levels (red lines) represent the likely price range for the pair over the next 24 hours based on current volatility readings.
CCI Indicator: If it enters the oversold region (below -250) or overbought region (above +250), it signals an impending trend reversal in the opposite direction.